A set of 39 differentially expressed genes (DEGs) appears critical to determine IPF
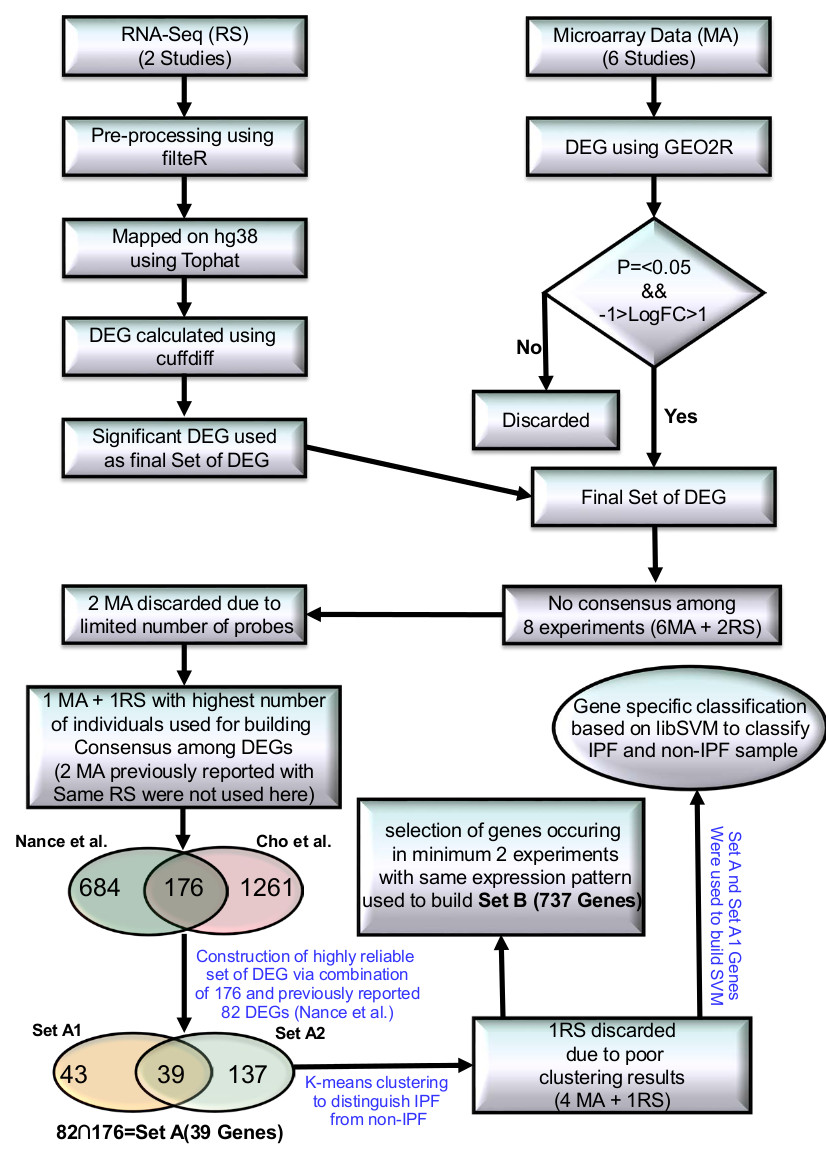
While two prior RNA-seq studies (Deng et al., Nance et al.)12-13 have been conducted, differed in their expression measurement approaches to identify the DEGs and had very limited agreement. After implementing a common expression analysis protocol (Tophat-cuffdiff17, see methods), about 70% reads could be mapped, resulting the identification of 487 and 860 DEGs in the two studies. 124 DEGs were found common between them. However, there was no DEG common across all the gene expression studies in IPF, clearly underlining the poor consensus in this area. This was potentially related to insufficient coverage in some studies due to limited number of MA probes. For example, data from the study done by Yue et al.7 covered only 4% of the total genes in the human genome.
Because of these irregularities, the two studies performed by Yue et al.7 and Vuga et al.8 were discarded. A previous study done by Nance et al.13 became the starting point for reliable information generation. This RNA-seq study had reported an overlap for 82 DEGs with two MA studies (Meltzer et al.10, Yang et al.11) (referred onwards as Set A1). We further found an overlap for 176 DEGs (referred onwards as Set A2) between this RNA-seq and the study done by Cho et al.9. The intersection of Set A1 and A2 was a set of 39 DEGs (referred onwards as Set A) (Supplementary Figure S1A, B). Since Set A genes were similarly differentially expressed across four different high throughput studies (Cho et al., Meltzer et al., Yang et al. and Nance et al.)9,10,11,13 we expected this set to be a more robust signature of IPF than the previously identified Set A113. To verify this, a comparative k-means cluster analysis was done over the sets while using Z-score transformed expression values.
With Set A1, the clustering analysis achieved accuracy of 92%, 83%, 98%, 100% and 87% (Table 1 Supplementary Figure S2). Clustering based on Set A was slightly better, yielding 92%, 89%, 97%, 100%, and 94% accuracy values (Table 1, Supplementary Figure S3). For the data from an RNA-seq study by Deng et al12, the clustering analysis with either set yielded only 67% accuracy. Due to very small size of this set, with three normal and three IPF individuals, this translates to only one misclassification per label. Besides this, these two different sets were also evaluated against cases of Sarcoidosis and Nonspecific Interstitial Pneumonia (NSIP), IIP diseases that are part of the differential diagnosis of IPF during clinical evaluation. Both the datasets perfectly distinguished all the cases for Sarcoidosis and NSIP from IPF (Table 1). Set A genes when chosen as the markers for IPF appeared better than previously considered top scoring pair (TSP) approach9. Benchmarking of study revealed only 5.1% misclassification of IPF samples with Set A genes while TSP approach had error of 11.2%. Further, TSP appeared biased towards experiments. This suggested potential diagnostic utility for this gene set.
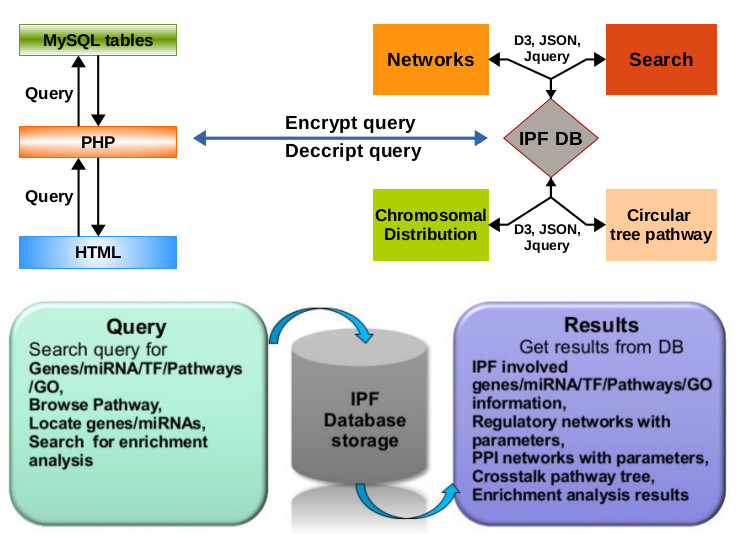
Moving a step further, the identified genesets were considered for classification by implementing a support vector machine (SVM) model based on the gene expression data. Details of implementations are given in the methods section and associated supplementary methods. The average accuracy over 10 different randomly built models was observed higher for Set A with 92.72% compared to 91.03% accuracy observed for Set A1 (Supplementary Figure S4). Also, the consistency and robustness of the classifiers with Set A genes was superior with higher average Matthews correlation coefficient (MCC) value of 0.85. Though, the performance difference between Set A1 and A is not very high, it is desirable to consider Set A as a better IPF marker set than A1 due to its shorter size and greater conservation across the available experimental data. Detailed results representing Area under curve (AUC), accuracy, specificity, sensitivity and MCC are given in Supplementary Table S1 and Figure S6. Also, it is noteworthy that the Sarcoidosis and NSIP individuals were classified with high accuracy as non-IPF cases (Supplementary Figure S6). This all clearly underlines that the recognized genesets are strong IPF markers, which could additionally be important in the elucidation of underlining molecular systems involved in IPF. Most of these genes were found associated with the process of lung development, maintenance, immune system signaling, collagen metabolism, Extracellular matrix (ECM) deposition, lipid metabolism, and cell-cell interactions, observation well supported by previous studies (Supplementary Table S2). An expression based classification and IPF classification tool has been provided at the associated portal. Considering the dependence on lungs biopsy samples to derive the expression data, the application of such classification system for IPF diagnosis may have practical limitations in most settings. However, it could be useful in high resource settings, where distinction between IPF and other IIPs is critical. In these settings, IPF patients may be referred to a lung transplant program, while NSIP or sarcoidosis may be treated with high doses of steroids. Open lung biopsies are not uncommon in this setting. Further, such a classification system displays the possibilities for future and could be useful in revalidation processes where the initial clinical diagnosis is discordant with the further clinical course.
After identifying the precise markers for IPF, the next objective was to define the system level map for IPF. Set A might be a useful as the prominent molecular marker for IPF. However, for pairwise comparison across the above mentioned five high throughout studies, a good consensus was observed for common DEGs (Supplementary Figure S1C, D). Presence of common genes across two totally different experiment sets may also be considered credible enough, though with lesser confidence than Set A genes. Considering such genes becomes useful to develop a system level map. With this view a new set of DEGs was created where every gene was found common to at least two different experimental studies. This resulted into a set of 737 DEGs, called Set B, the superset of Set A.
The regulatory components in IPF: Transcription Factors (TFs) and miRNAs
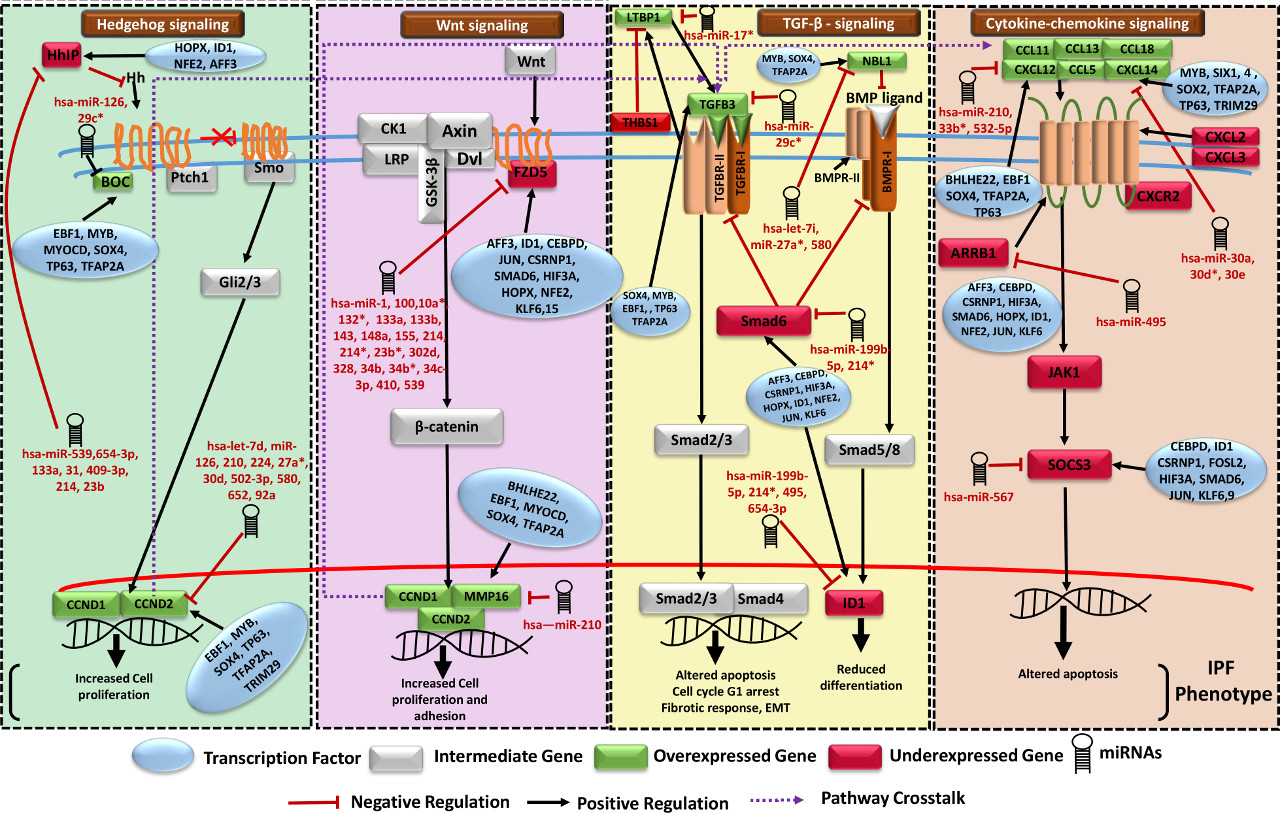
Previous studies provided some limited details on TFs with respect to IPF19-21. A total of 31 DEGs in the above mentioned Set B, were found as TFs. Among these, binding sites for 24 TFs were confirmed from literature and repository on experimentally validated TF-target interactions. Functional analysis emphasized on the fact that up-regulated TFs-target genes were associated with ECM-receptor interaction, Integrin family cell surface interactions, IGF-1 and TGF-? signaling pathways. TFAP2A was found regulating highest number of genes in case of upregulated TFs. Similar analysis was done for the down-regulated TFs where CEBPD was found targeting maximum genes (Supplementary Figure S7A, B). In general, processes like fatty acids metabolism and immune system regulation were found targeted by the down-regulated TFs, concurring well with previous findings on downregulated genes (Supplementary Table S3, S4, S5). ,/br>
miRNAs are one of the most important regulatory components of cell system. miRNAs like miR-29b, miR-26a and let-7 were found associated with IPF22-24. However, it was quite evident that insufficient full coverage high throughput experiments have been done for miRNAs while studying IPF. This becomes more conspicuous when one looks for more sensitive method like s/RNA-seq based studies where a big void exists. In the current study, high throughput data generated from three MA based studies (Cho et al., Yang et al., Milosevic et al.)9,11,25 were considered for differential expression analysis of miRNAs in IPF, initially. However, no reliable sRNA-seq study was found for IPF. To overcome such scarcity, a strategy was employed where an RNA-seq data13 generated for longer RNA like mRNAs was utilized to indirectly derive the expression of miRNAs. Details are given in the methods section.
The relation between the precursor miRNA expression obtained from RNA-seq was compared with the same for mature miRNA expression obtained through MA. It was observed that most of the mature miRNAs displayed strong positive correlation for the precursor derived expression using RNA-seq data. A total of 54 overexpressed and 82 underexpressed miRNAs were detected (Supplementary Figure S8). An overlap was observed for 53 downregulated and 37 upregulated microRNAs from previously reported studies. 42 novel miRNAs (16 up and 26 down) were identified in this study (Supplementary Table S8). 53 out of 54 upregulated and 75 among 82 downregulated miRNAs were found potentially targeting 5,969 and 7,728 genes, respectively. Experimental support was obtained for 818 interactions from all experimental data, including CLASH/CLIP-seq analysis. Experimentally supported miRNA interactions had 43 upregulated and 59 downregulated miRNAs, targeting 235 and 428 genes, respectively. Compared to previous studies9,11,25, the finding on miRNAs is more robust and elaborated due to inclusion of data from multiple experiments including next generation sequencing. miR-539 (overexpressed) and miR-30 family (underexpressed) were obtained as targeting the maximum number of genes (Supplementary Table S9). The interesting question yet to resolve was that how these regulators work together to define the molecular systems of IPF. The following sections address the same.
Gene regulatory network (GRN) and potential Feed-Forward Loops (FFLs) in IPF
Co-regulation of miRNAs and TFs on same target genes was found to be most common in mammalian genomes26. Network motifs in the form of 3 and 4 nodes recurring circuits, referred as FFLs, are considered important in understanding molecular mechanism of disease through capturing the disease expressing network circuits27-30. Realizing the importance of the combined effects of various regulatory components, IPF specific network motifs were studied in terms of potential FFLs and concerted regulatory orientations in IPF. While motifs other than FFL are also likely to be important in IPF, here we focused exclusively of FFL because of their instability and potential for dysregulation.
For Set A based potential FFLs, an important observation was that two miRNA-FFLs were consisted of miR-210 targeting matrix metalloproteinase gene (MMP16) in combination with TFs MYOCD and RUNX2. MMP16 is known to be involved in collagen bundle assembly which was observed as upregulated due to downregulation of miR-210 in IPF. This gives explanation for the observation from the previous study which reported that MMP16 is characteristically upregulated in IPF31. Another important observation was the identification of miR-30 family downregulation which goes in line with a previous study24. miR-30 was found regulating highest number of potential FFLs, mainly consisting of Tetraspanin, involved in alveolar epithelial integrity32, PTGFRN, involved in fibroblasts proliferation and collagen production33 as well as SFRP2, a modulator of Wnt signaling and a chemokine gene CXCL14, responsible for their overexpression during disease in combination with differentially upregulated TFs BHLHE22 and SIX4.
TF-FFLs for larger network of Set B was composed of 49 miRNA-gene, 63 TF-gene and 32 TF-miRNA interactions (Supplementary Dataset 1). Within TF-FFLs, a differentially downregulated TF, NFE2 (antioxidant enzymes regulator), emerged as an important regulator, targeting crucial genes of IPF phenotypes (FZD5, HHIP, CRTAC1 and EPB41L5) through direct targeting and via upregulation of miR-214. Interesting findings from this study was the observation of potential regulatory circuits having five miRNA clusters. Clusters of [miR-181a, miR-181b], [miR-93, miR-106b], [miR-17, miR-18a, miR-92a] and [miR-30b, miR-30d] were differentially downregulated whereas cluster of miR-133a and miR-1 was upregulated in IPF. Down regulated miRNA clusters were associated with genes involved in Wnt, p53, Jak-STAT, PI3K-Akt, Prolactin signaling and cell adhesion molecules (CAMs) whereas upregulated miRNA cluster was found targeting genes of Fructose and mannose metabolism, cAMP, Hedgehog, PPAR, AMPK signaling, Sphingolipid and fatty acid metabolism. In this way, several network motifs in the form of potential FFLs were identified regulating mainly the process of extracellular matrix organizations, apoptosis, cell proliferation and fatty acid metabolism. Besides having the potential FFL view, it was evident that for many miRNAs multiple targets existed while for several genes multiple targeting miRNAs existed.
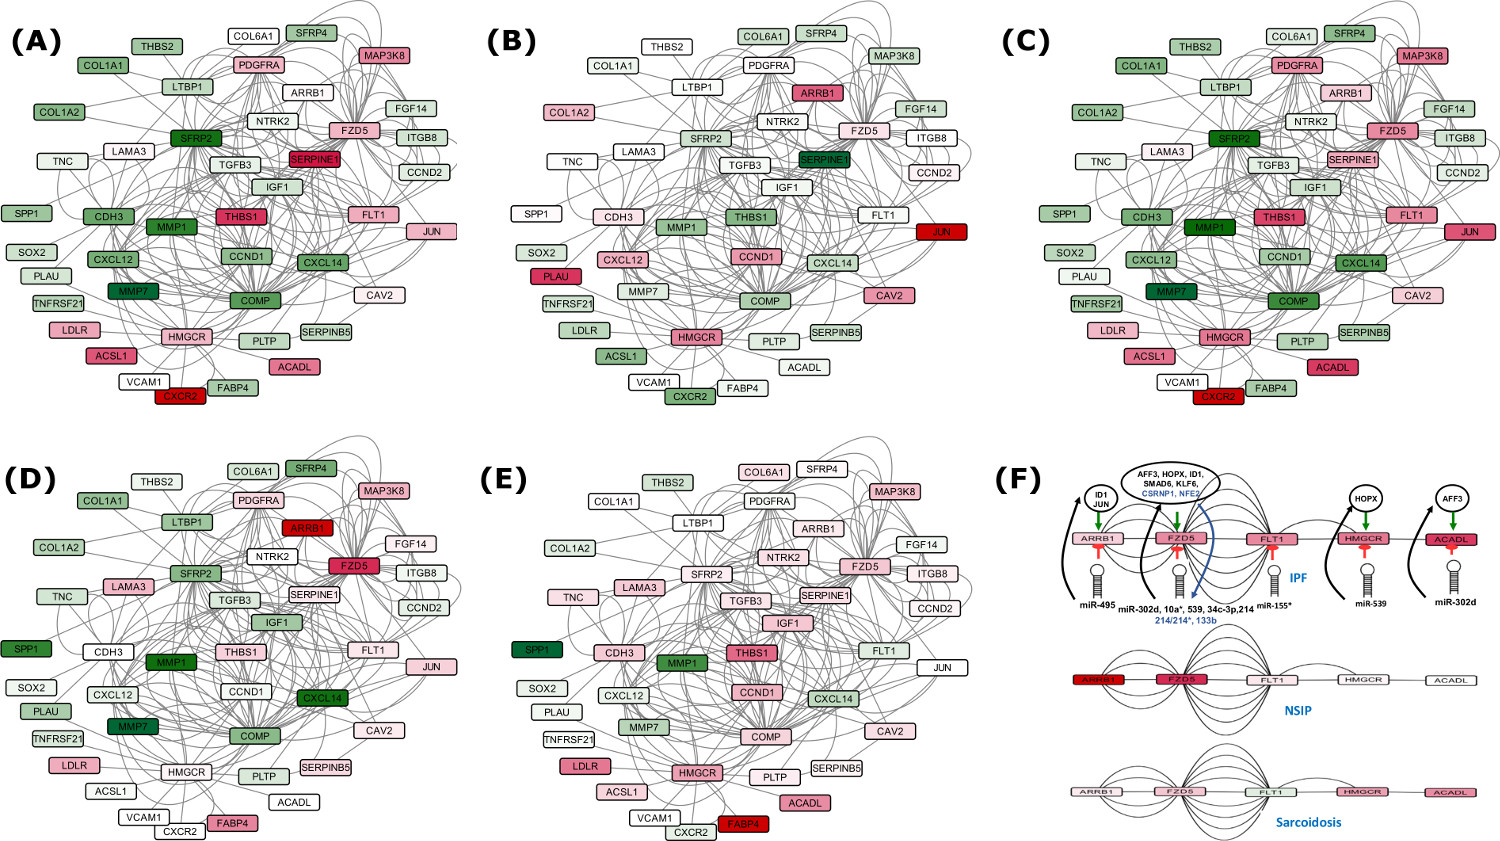
Gene regulatory networks were constructed based on the involvement of several common DEGs in IPF, using various network parameters. The networks consisted of 940 nodes connected through 20,207 edges for the set of 737 genes (Set B), and 256 nodes joined via 1,663 edges in the subnetwork of 39 genes (Set A), depicting various important nodes of multiple connectivity. Genes FZD5 along with KCNMA1 involved in repolarization of membrane potential were found as the most important nodes containing highest in-degrees in the GRN of Set A. KCNMA1 gene was observed upregulated in IPF contrary to FZD5. The observations with KCNMA1 is critical because smooth cell/myofibroblast activity is enhanced during IPF where KCNMA1 has a stake. On the other hand, FZD5 is involved in several biological pathways such as Wnt signaling, Hippo signaling and was found downregulated in IPF. Hub gene FZD5 was observed targeted through upregulated miR-155 whose upregulation was supported by a previous study in favor of EMT process34. The underexpressed miR-627 and miR-30 families were observed as critical regulatory hub miRNAs responsible for overproduction of mucin type O-Glycans, increased ECM accumulation and stimulation of mTOR signaling, Cytokine-cytokine receptor interaction, Chemokine signaling and cardiomyopathy. Similarly, upregulated hub miRNA miR-539 was observed targeting the genes involved in steroid biosynthesis (Supplementary Table S9 and S11). In overall, the upregulated DEGs in the GRN were enriched in ECM receptor interaction, p53 signaling pathway, ABC transporters and cell adhesion molecules (CAMs). The downregulated DEGs were found enriched in fatty acid metabolism and AMPK signaling pathways. Detailed discussion on this section is covered in supplementary discussion section.
