Performance of miR-BAG:
miR-BAG is a novel, reliable and accurate tool for prediction of miRNA genes with three fold prediction applicability:
i. Prediction from individual sequences
ii. Prediction from genomic sequences
iii. Prediction from Next Generation Sequencing data
Currently this tool works on nematode species, insect species and works for animals species. For each species the most sturdy training and testing datasets were created by random selection of sequences from the positive and negative datasets using in-house built scripts. The training sets consisted of equal say from the positive and negative sets. The negative set incorporated sequences from rRNAs, snoRNAs, snRNAs, tRNAs, Alu elements, SINE elements and pseudo hairpins as shown in the table 1
Table 1 Number of sequences used in testing and training sets
|
Training set |
Testing set |
|
+ve |
-ve |
+ve |
-ve |
|
miR |
r |
sno |
sn |
t |
sines |
ps |
miR |
r |
sno |
sn |
t |
sines |
ps |
| Homo sapiens |
584 |
98 |
98 |
98 |
86 |
5 |
250 |
500 |
97 |
97 |
97 |
86 |
5 |
225 |
| Canis familiaris |
158 |
34 |
34 |
34 |
0 |
0 |
55 |
159 |
33 |
35 |
35 |
0 |
0 |
53 |
| Mus musculus |
348 |
75 |
75 |
75 |
0 |
0 |
123 |
348 |
75 |
75 |
75 |
0 |
0 |
123 |
| Rattus norvegicus |
195 |
43 |
45 |
44 |
0 |
0 |
60 |
196 |
30 |
30 |
30 |
0 |
0 |
84 |
| Drosophila melanogaster |
112 |
12 |
24 |
11 |
25 |
0 |
40 |
113 |
13 |
24 |
11 |
25 |
0 |
40 |
| Caenorhabditis elegans |
108 |
5 |
25 |
25 |
25 |
0 |
25 |
109 |
5 |
25 |
25 |
25 |
0 |
25 |
where miR= miRNA containing sequences, r= rRNA sequences, sno= snoRNA sequences, sn= snRNA sequences, t= tRNA sequences, ps= pseudo-hairpin sequences
|
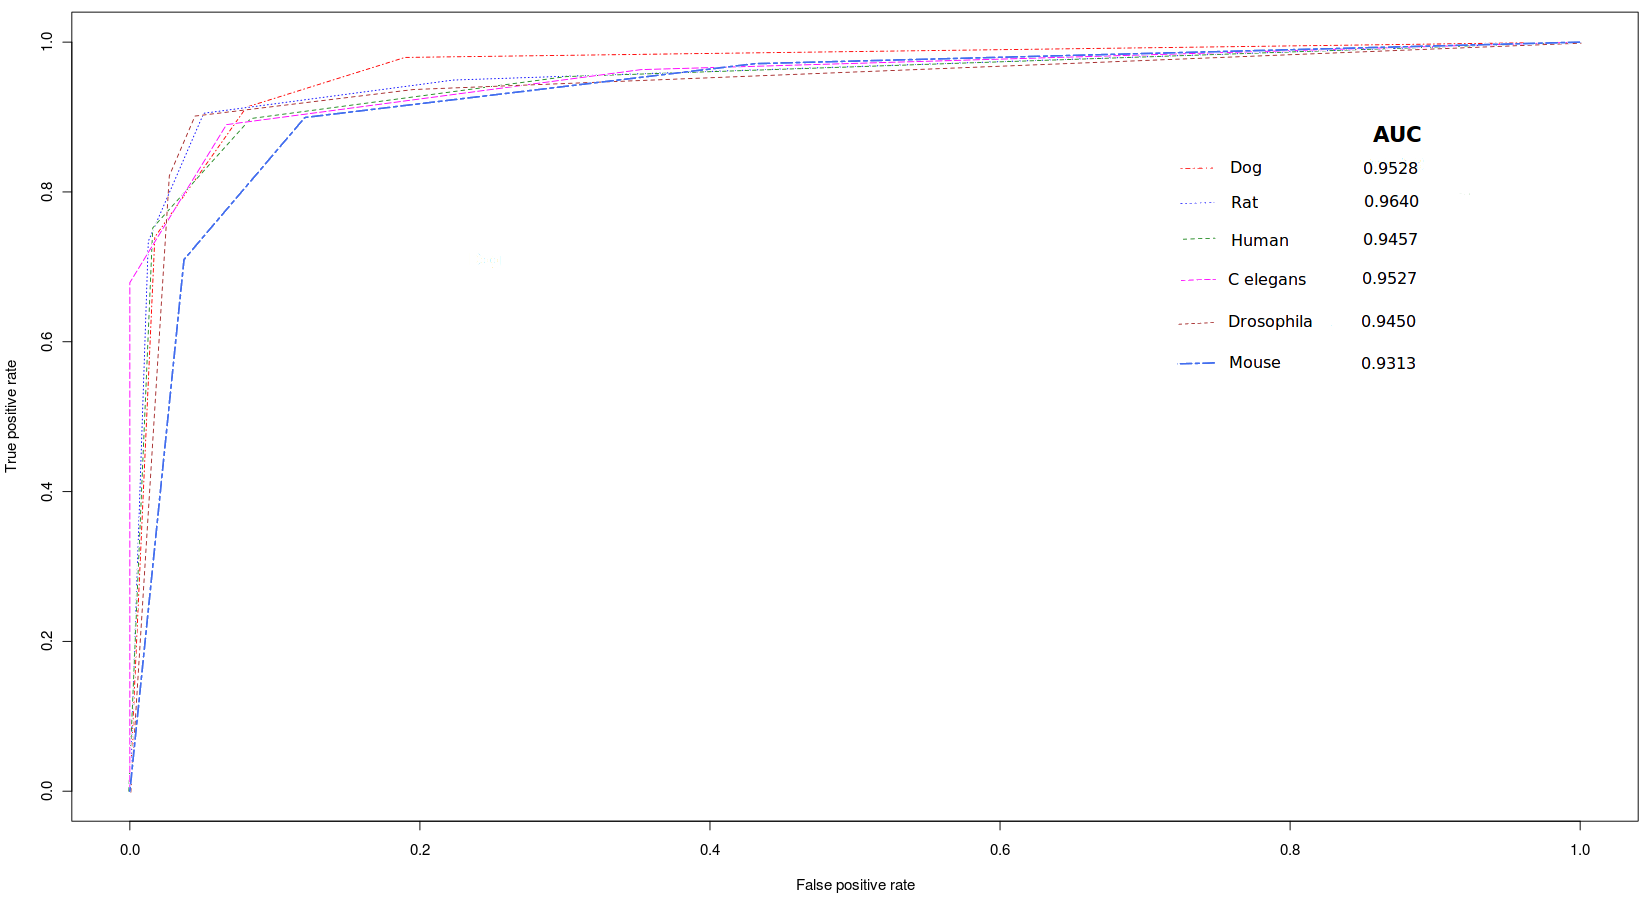
For most of the classifiers an accuracy > 90% was achieved with an average accuracy of 91%. The average sensitivity was 89% with an average specificity of 93%. The highest Accuracy of (93.24%) as well as highest MCC (0.86) was achieved by Rattus norvegicus (Table 2).
Table 2 Performance of miR-BAG on different species.
| Species |
TP |
FN |
TN |
FP |
Sensitivity |
Specificity |
Accuracy |
MCC |
| Homo sapiens |
449 |
51 |
556 |
51 |
0.89 |
0.91 |
0.90 |
0.81 |
| Canis familiaris |
143 |
16 |
150 |
6 |
0.89 |
0.96 |
0.93 |
0.86 |
| Mus musculus |
302 |
46 |
319 |
29 |
0.86 |
0.91 |
0.89 |
0.78 |
| Rattus norvegicus |
184 |
12 |
161 |
13 |
0.93 |
0.92 |
0.93 |
0.86 |
| Drosophila melanogaster |
102 |
11 |
108 |
5 |
0.90 |
0.95 |
0.92 |
0.85 |
| Caenorhabditis elegans |
97 |
12 |
98 |
7 |
0.88 |
0.93 |
0.91 |
0.82 |
where TP= True Positive, FN= False Negative, TN= True Negative, FP= False Positive, MCC= Matthew's Correlation Coefficient |
miR-BAG employs three classifiers to generate a single classifier using the bootstrap aggregating methodology (Bagging), the effect of the three classifiers was also analyzed by removing each of them one by one and observing the effect of the classifier on performance. The performance was tested on animal classifiers (Homo sapiens) as shown below.
Table 3 Effect of different classifiers
| Homo sapiens |
Sensitivity(%) |
Specificity(%) |
Accuracy(%) |
| All three classifiers |
89.80 |
91.59 |
90.78 |
| SVM and Naive bayes |
95.0 |
76.46 |
83.73 |
| Best First Decision Tree and Naive bayes |
93.20 |
76.27 |
83.92 |
| Best First Decision Tree and SVM |
92.40 |
80.56 |
85.90 |
miR-BAG introduces two novel features along with a novel implementation of a previously existing feature. To analyze the effectiveness of these features, feature selection was performed and it was shown that the two features had a significant contribution to the overall classification.
Table 4 Feature score of matrix for different species.
| Species |
Matrix based scoring
|
|
Rank |
f-score |
| Homo sapiens |
17 |
0.53 |
| Canis familiaris |
2 |
1.16 |
| Mus musculus |
1 |
0.81 |
| Rattus norvegicus |
1 |
1.02 |
| Drosophila melanogaster |
49 |
0.33 |
| Caenorhabditis elegans |
1 |
0.72 |
To further analyze effect of structural profile based matrix, a study was performed whereby, matrix scoring feature was removed and classification was done using the remaining features. This proved to be a prescient move as it clearly distinguished the contribution of structural profile based matrix.
Table 5 Effect of matrix on classification
|
Classification With Matrix |
Classification Without Matrix |
| Species |
Sensitivity (%) |
Specificity (%) |
Accuracy (%) |
Sensitivity (%) |
Specificity (%) |
Accuracy (%) |
| Homo sapiens |
89.80 |
91.59 |
90.78 |
91.00 |
90.44 |
90.69 |
| Canis familiaris |
89.93 |
96.15 |
93.01 |
91.19 |
95.51 |
93.33 |
| Mus musculus |
86.78 |
91.66 |
89.22 |
89.94 |
87.93 |
88.93 |
| Rattus norvegicus |
93.87 |
92.52 |
93.24 |
92.34 |
91.37 |
91.89 |
| Drosophila melanogaster |
90.26 |
95.57 |
92.92 |
85.84 |
94.69 |
90.26 |
| Caenorhabditis elegans |
88.99 |
93.33 |
91.12 |
88.07 |
93.33 |
90.65 |
Benchmarking:
miR-BAG was compared with six other tools on test data set of Homo sapiens. To analyze
the performance of miR-BAG.
Table 6 Performance of miR-BAG against six different software on unseen data.
| Animal (Human) |
Sensitivity(%) |
Specificity(%) |
Accuracy(%) |
| miRPara |
83.80 |
78.91 |
81.12 |
| miRNASVM |
43.20 |
94.72 |
71.45 |
| mirEval |
81.40 |
79.24 |
80.21 |
| Triplet SVM |
70.20 |
93.57 |
83.02 |
| microPred |
16.60 |
67.54 |
44.53 |
| CSHMM |
98.40 |
24.05 |
57.63 |
| miR-BAG |
89.80 |
91.59 |
90.78 |
ROC Curve:
Animal Classifiers ROC Curve: