About miR-BAG:
The motivation behind miR-BAG is the development of an accurate tool with the ability and robustness to predict miRNAs from the genomic sequences as well as from Next Generation Sequencing data. miR-BAG is a novel approach as it incorporates novel features and suggests a novel implementation of a previously existing feature. miR-BAG works on the basic principle that structure of mature miRNA region is more conserved due to its functional relevance than the structure of pre-miRNA. Basically, miR-BAG conflates some of the previously existing features used by many algorithms with some novel features introduced in miR-BAG. miR-BAG can accept individual sequences, genomic sequences as well as NGS read sequences as input.
miR-BAG applies a bootstrap aggregating approach to create an ensemble of three different approaches (naïve Bayes, Best First Decision tree and SVM) to achieve a high accuracy. At present miR-BAG includes 6 different species, 4 for animals (Homo sapiens, Canis familiaris, Mus musculus, Rattus norvegicus) alongwith one nematode (Caenorhabditis elegans) and one insect species (Drosophila melanogaster). miR-BAG was found to perform consistently with accuracy level higher than 90% for several species.
miR-BAG has been implemented with multithreaded parallel architecture using java concurrent library and the standalone was made using Qt4 C++ library. Due to incorporation of concurrency, the execution speed of miR-BAG has increased manifolds resulting in higher performance in lesser runtime. miR-BAG creates multiple threads simultaneously at different levels of execution leading to reduction in execution time.
The feature data was generated on 200 nucleotide long primary windows. Assuming positional relevance of sequence and structural features, each sequence is divided into 3 different windows, two of which are sliding windows. Thus, miR-BAG features can be classified into two classes; Class I and Class II
Class I features:
These features are calculated in the windows of size 21 nts with a step size of 1 nt. In each window various features were calculated simultaneously using multithreaded architecture. To calculate the features the windows were distributed in three parts : left sliding window, right sliding window and a central fixed window.
Class II features:
These features are calculated over the entire sequence. miR-BAG uses multiple threads to calculate matrix score. The matrix score is calculated for each fragment whose length is equal to size of matrix. After scanning, the log of the highest score is chosen.
The minimum length requirement of input sequences is 200 bases, if the sequence is longer than 200bp then miR-BAG creates overlapping sequences of 200 bases from the input sequence. Once the input has been provided, miR-BAG makes the structure of the sequence using RNAfold and then calculates different features. miR-BAG then creates different threads representing different windows used to calculate data over the sequence. The structure is aligned with the existing Structural profiles in the matrix and the best profile is used to assign score for the structure. Once data for different windows and sequence has been generated the data is written in a file. miR-BAG makes prediction on the basis of this data.
Our methodology has resulted in achieving an accuracy of > 90% in most of the species with high sensitivities and specificities. The Area Under Curve achieved by miR-BAG is above 0.9 in most of the cases and the details can be found in Performance tab.
Classifier:
miR-BAG uses an ensemble method of bootstrap aggregating which utilizes three different classifiers; naive Bayes, Best First Decision Tree and Support Vector Machine (SVM). The advantage of bagging is that it ensures better performance than a single classifier with possible amount of error always less than error made by a single classifier. Bagging does not focus on any particular instances and the probability of choosing instances is equal, which makes bagging less prone to overfitting.
a) Naive Bayes- The Naïve Bayes classifier estimates the class probability by assuming conditional independence between the features.
Where
P(X) = Prior probability of observing the feature vector X
P(Y|X) = Posterior probability of the given hypothesis Y (identified class)
P(Xi|Y) = Posterior conditional probability of observing ith feature's value Xi, given prior of hypothesis
b) Best First Decision Tree- Best first decision tree expands the best nodes first while creating the tree. The best node is the node whose split reduces the maximum impurity. This node can be any node in case of Best First Decision Tree but in case of Standard Decision Tree, the nodes are built by Depth first search order and therefore the node is always the same. At every split step, the number of terminal nodes increases by one in Best First Decision Tree in contrast to Decision tree where nodes other than terminal nodes are expanded.
c) Support Vector Machine (SVM)- SVM forms a decision boundary with maximum error margin hyperplanes to classify instances based on learning set which find global solution. The SVM kernel implemented in the present work is Gaussian kernel whose equation is :
 |
where K=kernel of functions X and Y |
The basic bagging algorithm:
Input:
D, a set of training samples
Let K be the number of bootstrap samples.
C, a vector of learning schemes ( Naive Bayes, BFTree and SVM)
Method:
1. for I = 1 to k do
2. Create a bootstrap sample of size N, Di
3. for j = 1 to C do
4. Train a base classifier Cj on the bootstrap sample Di
5. end for
6. end for
7. C*(x) = argmax ∑i δ(Ci(x) = y).
Methodology
Dataset Generation:
Genomic sequences of humans were downloaded from UCSC while the genomic sequences of other animal species (Rattus norvegicus, Mus musculus, Canis familiaris, Caenorhabditis elegans, Drosophila melanogaster) were downloaded from Ensembl.
The pre-miRNA and mature miRNA sequences and their co-ordinates were downloaded from miRBase version 18. The sequences for mRNA, rRNA, snoRNA, snRNA and tRNA and their co-ordinates were downloaded from UCSC and Ensembl. The Alu sequences and the different SINE element sequences were generated after execution of RepeatMasker on the human genome.
Positive dataset generation:
Using the co-ordinates of known pre-miRNAs the sequences of 200 bases were extracted from the genome. Thus, the positive dataset consists of known pre-miRNA sequences with the center of loop as the central position in the sequence and fragment of 200 was created taking 100 bases upstream and downstream.
Negative dataset generation:
The negative dataset consists of many different types of RNA sequences including ribosomal RNA, small nucleolar RNA, small nuclear RNA, transfer RNA, SINE element sequences and pseudo hairpins generated from mRNA sequences. Negative dataset was also created using center of loop as reference and taking 100 bases upstream and 100 bases downstream.
Classification
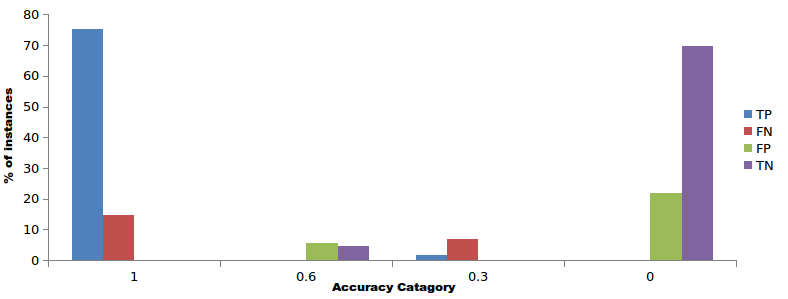
miR-BAG classifies the data file to predict miRNAs using the bagging approach. The output contains The sequence accession ID alongwith the prediction score which can be either 0, 0.33, 0.67, or 1.0. Here 0 and 0.33 correspond to the negative predictions and 0.67 or 1.0 correspond to the positive predictions as shown in Figure 1 below. In this figure the score distributions of human classification system is shown
Figure 1 Score distribution for classification
The accuracy, sensitivity, specificity and MCC of miR-BAG was calculated using the following equations:
Sn = TP / (TP+FN)
Sp = TN / (TN+FP)
Acc = (TN+TP) / (TN+FP+TP+FN)
MCC = {(TP∗TN) − (FP∗FN)} / √(TP+FN) ∗ (TP+FP) ∗ (TN+FP) ∗ (TN+FN)
Where TP = True Positives
TN = True Negatives
FP = False Positives
FN = False Negatives
Sn = Sensitivity
Sp = Specificity
Acc = Accuracy
MCC = Matthew's Correlation Coefficient
Feature selection
Feature selection allows the examination of contributions of each feature. Feature scores were calculated using the following formula
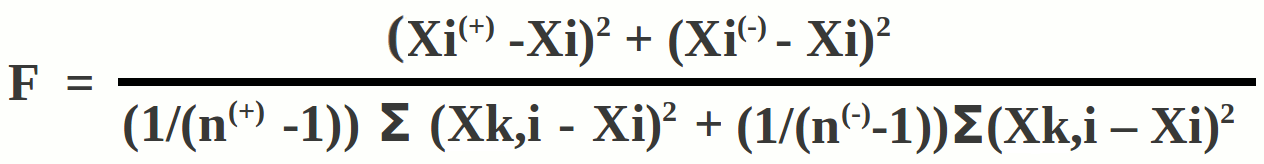
Where
F = Feature score
Xi(+) = Mean value of i-th feature in experimentally validated positive instances
Xi(-) = Mean value of the i-th feature in negative instances
Xi = Overall mean value of the i-th feature
Xk,i(+) = Feature value for k-th positive instance for i-th feature
Xk,i(-) = Feature value for k-th negative instance for i-th feature
miR-BAG NGS module
Figure 2: miR-BAG NGS module workflow