miRbiom

(A Machine Learning Approach to Profile miRNAs)

  Home    Method    Download   About Us 
About the miRbiom server

The miRbiom server (https:/scbb.ihbt.res.in/miRbiom-webserver) is a miRNA profiler software. The purpose of the miRbiom server is to predicted an accurate profie the miRNAs without any need for miRNA-sequencing or array profiling experiments. For any given condition, the users needs to provide the transcriptome profiling data and just run the software after loading it. The data passed through causal networks for miRNAs which explain the miRNA biogenesis. In term, the network is mapped for the component genes expression data on which XGBoost regression machine learning system takes decision. Finally the XGBoost machine learning system gives the relative expression scores of all the miRNAs for the given condition. It generates interactive plot of expression profiles of different miRNAs. Selections can be made to study the miRNA targets for their functional enrichment and associated pathways. miRNA target information comes from various databases like miRTarbase etc. Provisions were also made for mapping the miRNA targets collectively and displaying them in maps of KEGG pathways. The implementation details of this part is given below in Figure1 and Figure 2:

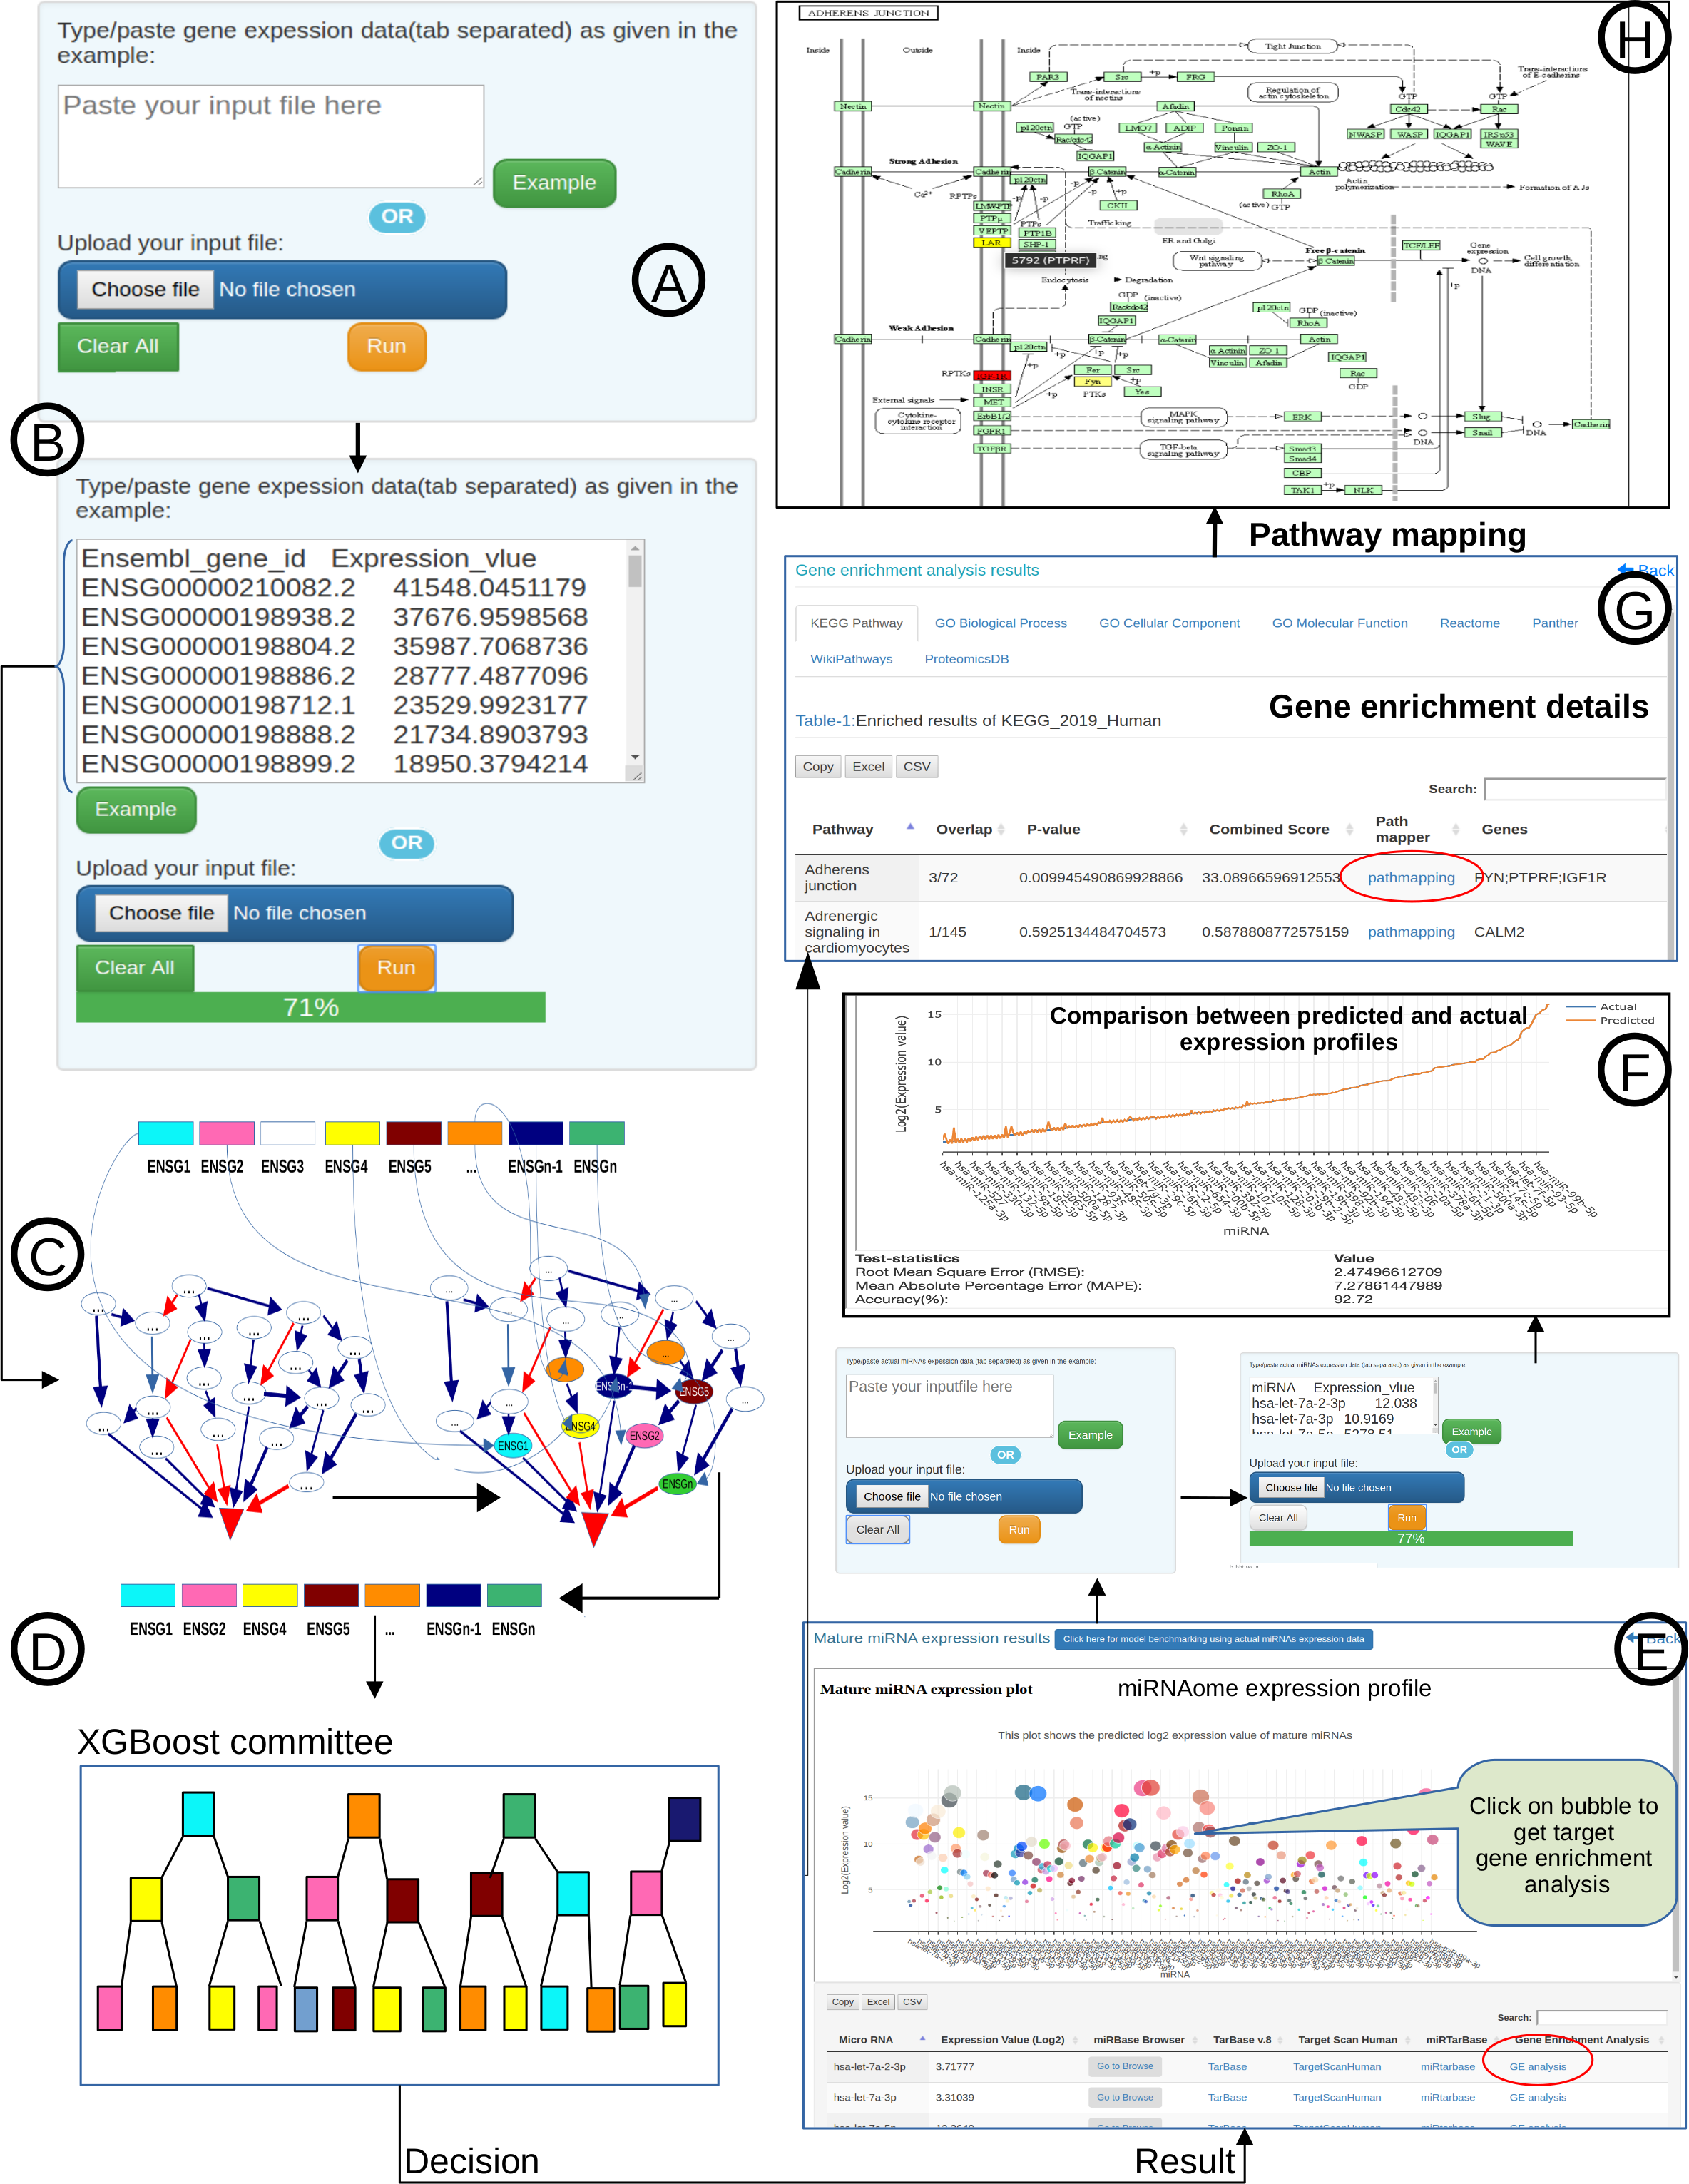
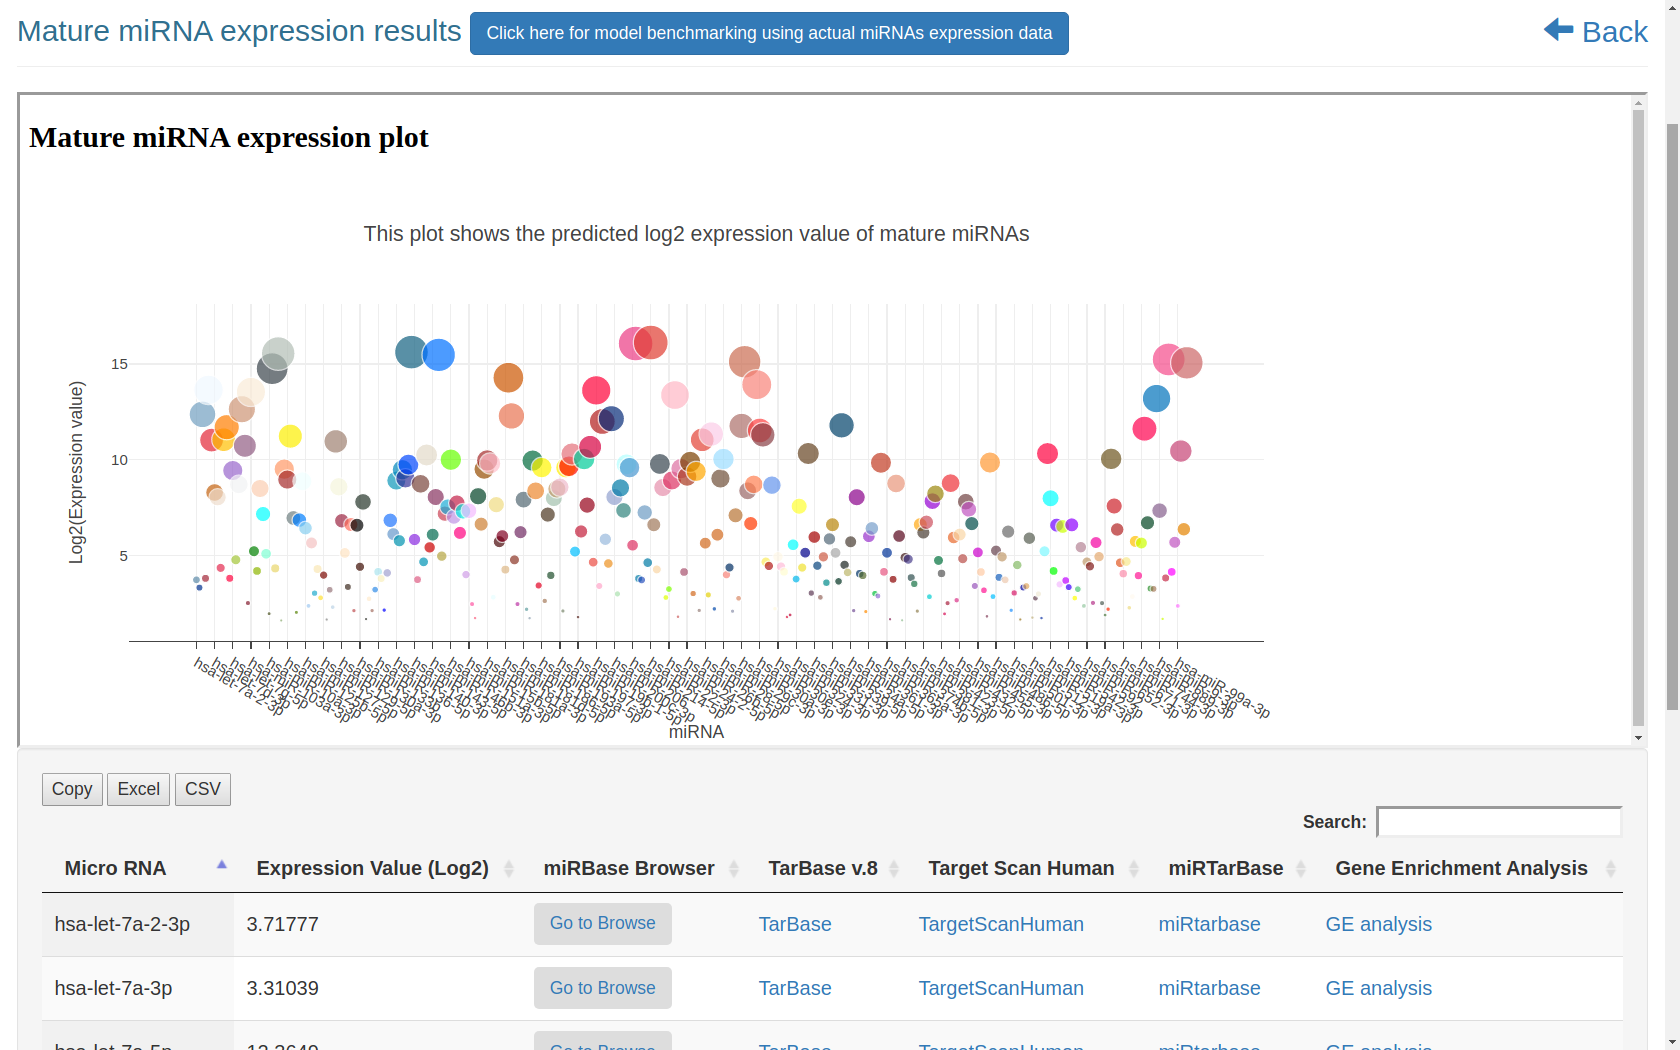
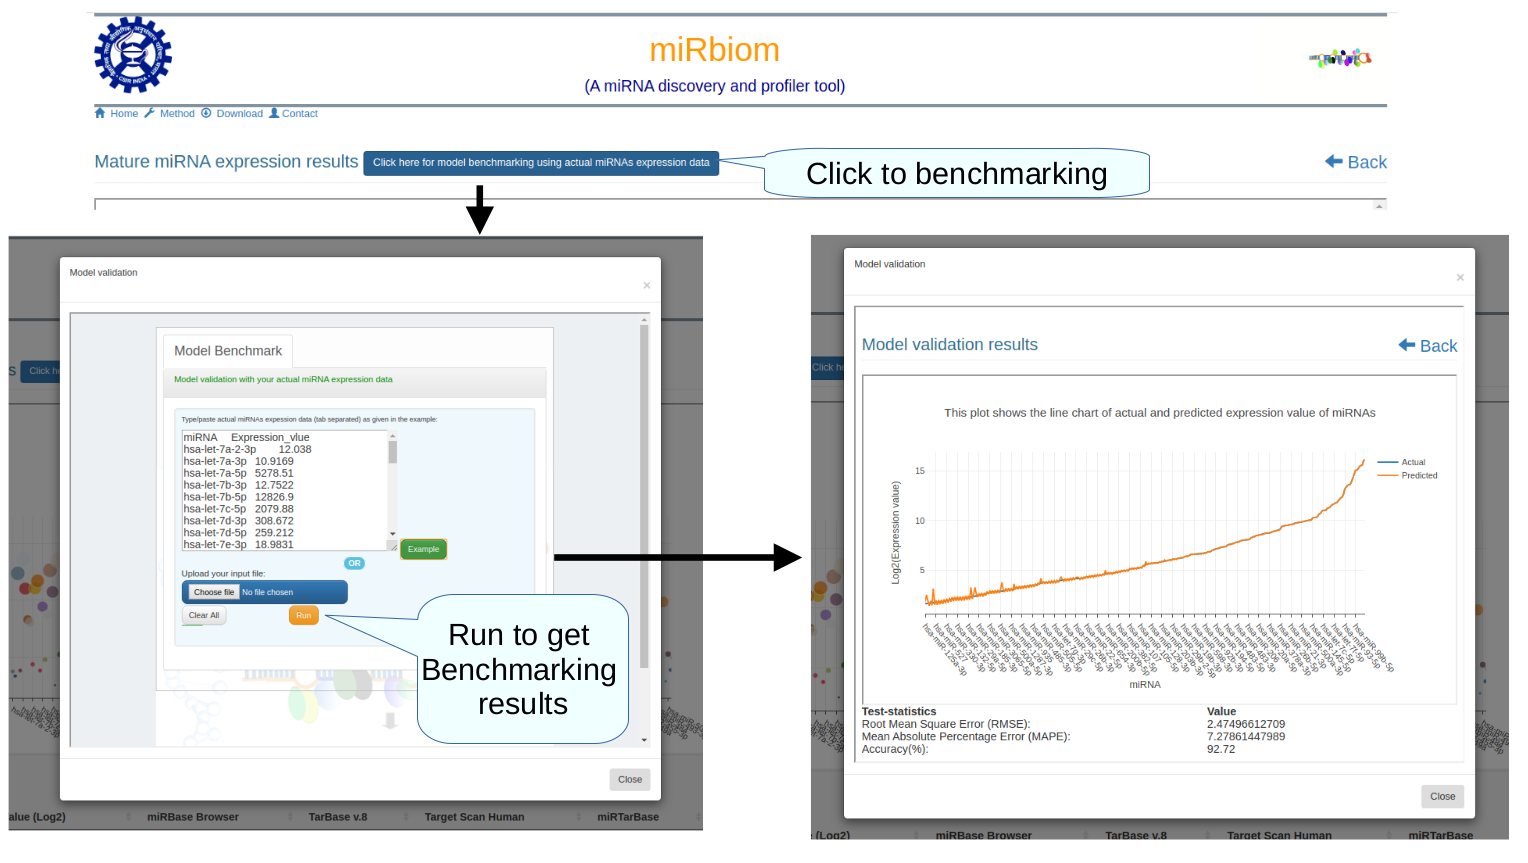
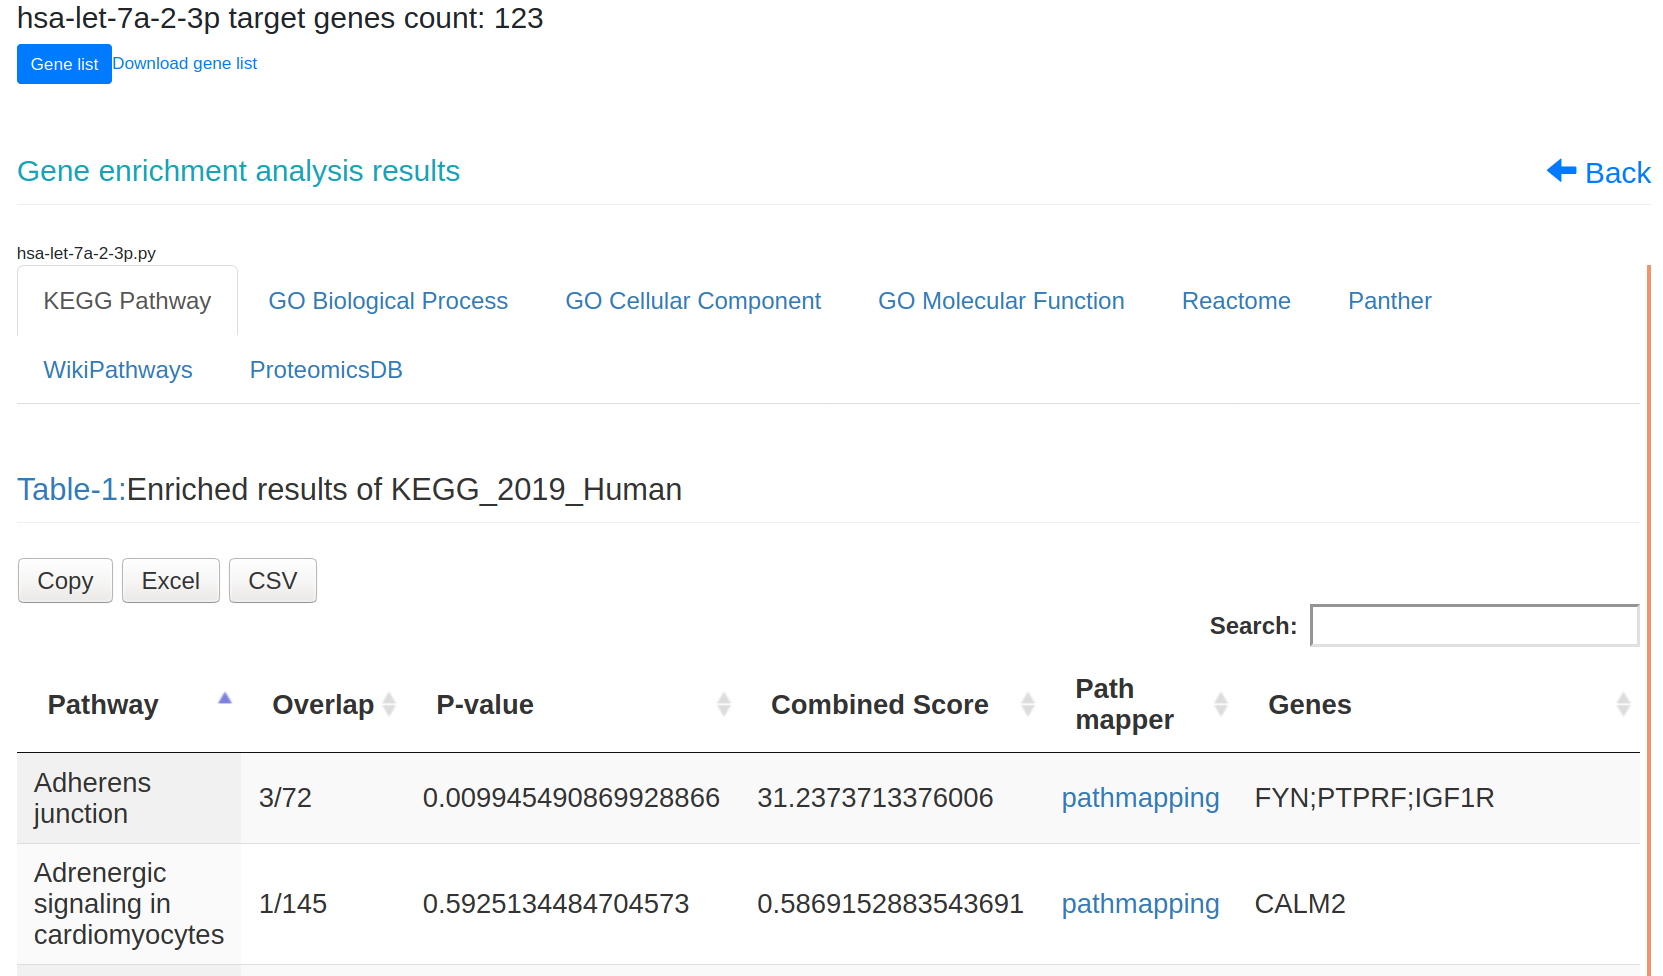
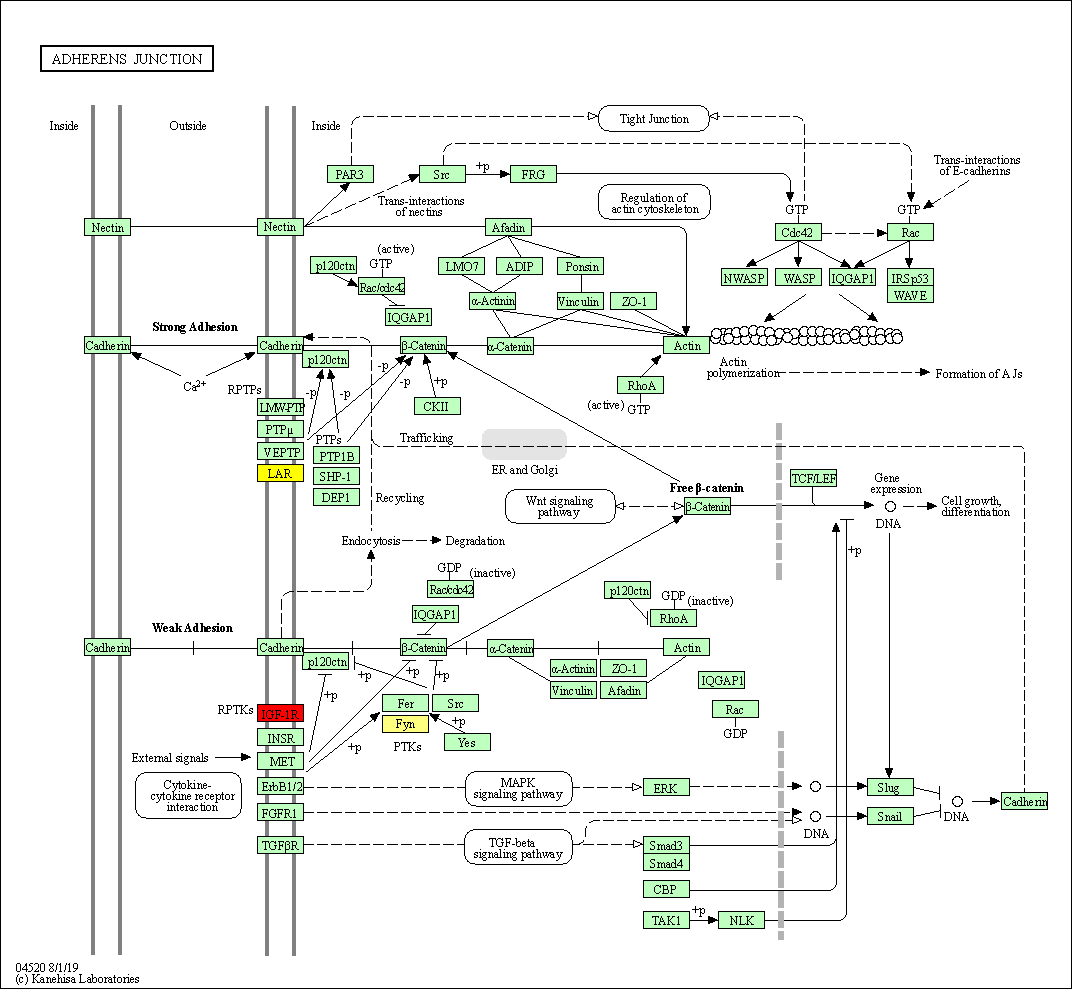
Figure-1: miRbiom webserver implementation. A) Input data box where the user can either paste or load the input file, B) Input is transcriptome expression data with Ensembl IDs which is in turn normalized by the server, C) The causal network components are consulted and loaded with their respective expression data, D) XGBoost regression uses the network expression data to generate a jury of classifiers which commonly reach to decision with the expression profiles for various miRNAs in one go, E) Expression profile result is generated in the form interactive plot and table, F) A module is provided to compare the predicted profile with the actual profile for test purpose, if the user wishes to, G) Functional enrichment analysis tabs for the targets of the miRNAs, H) Pathways mapping module for the miRNA targets.


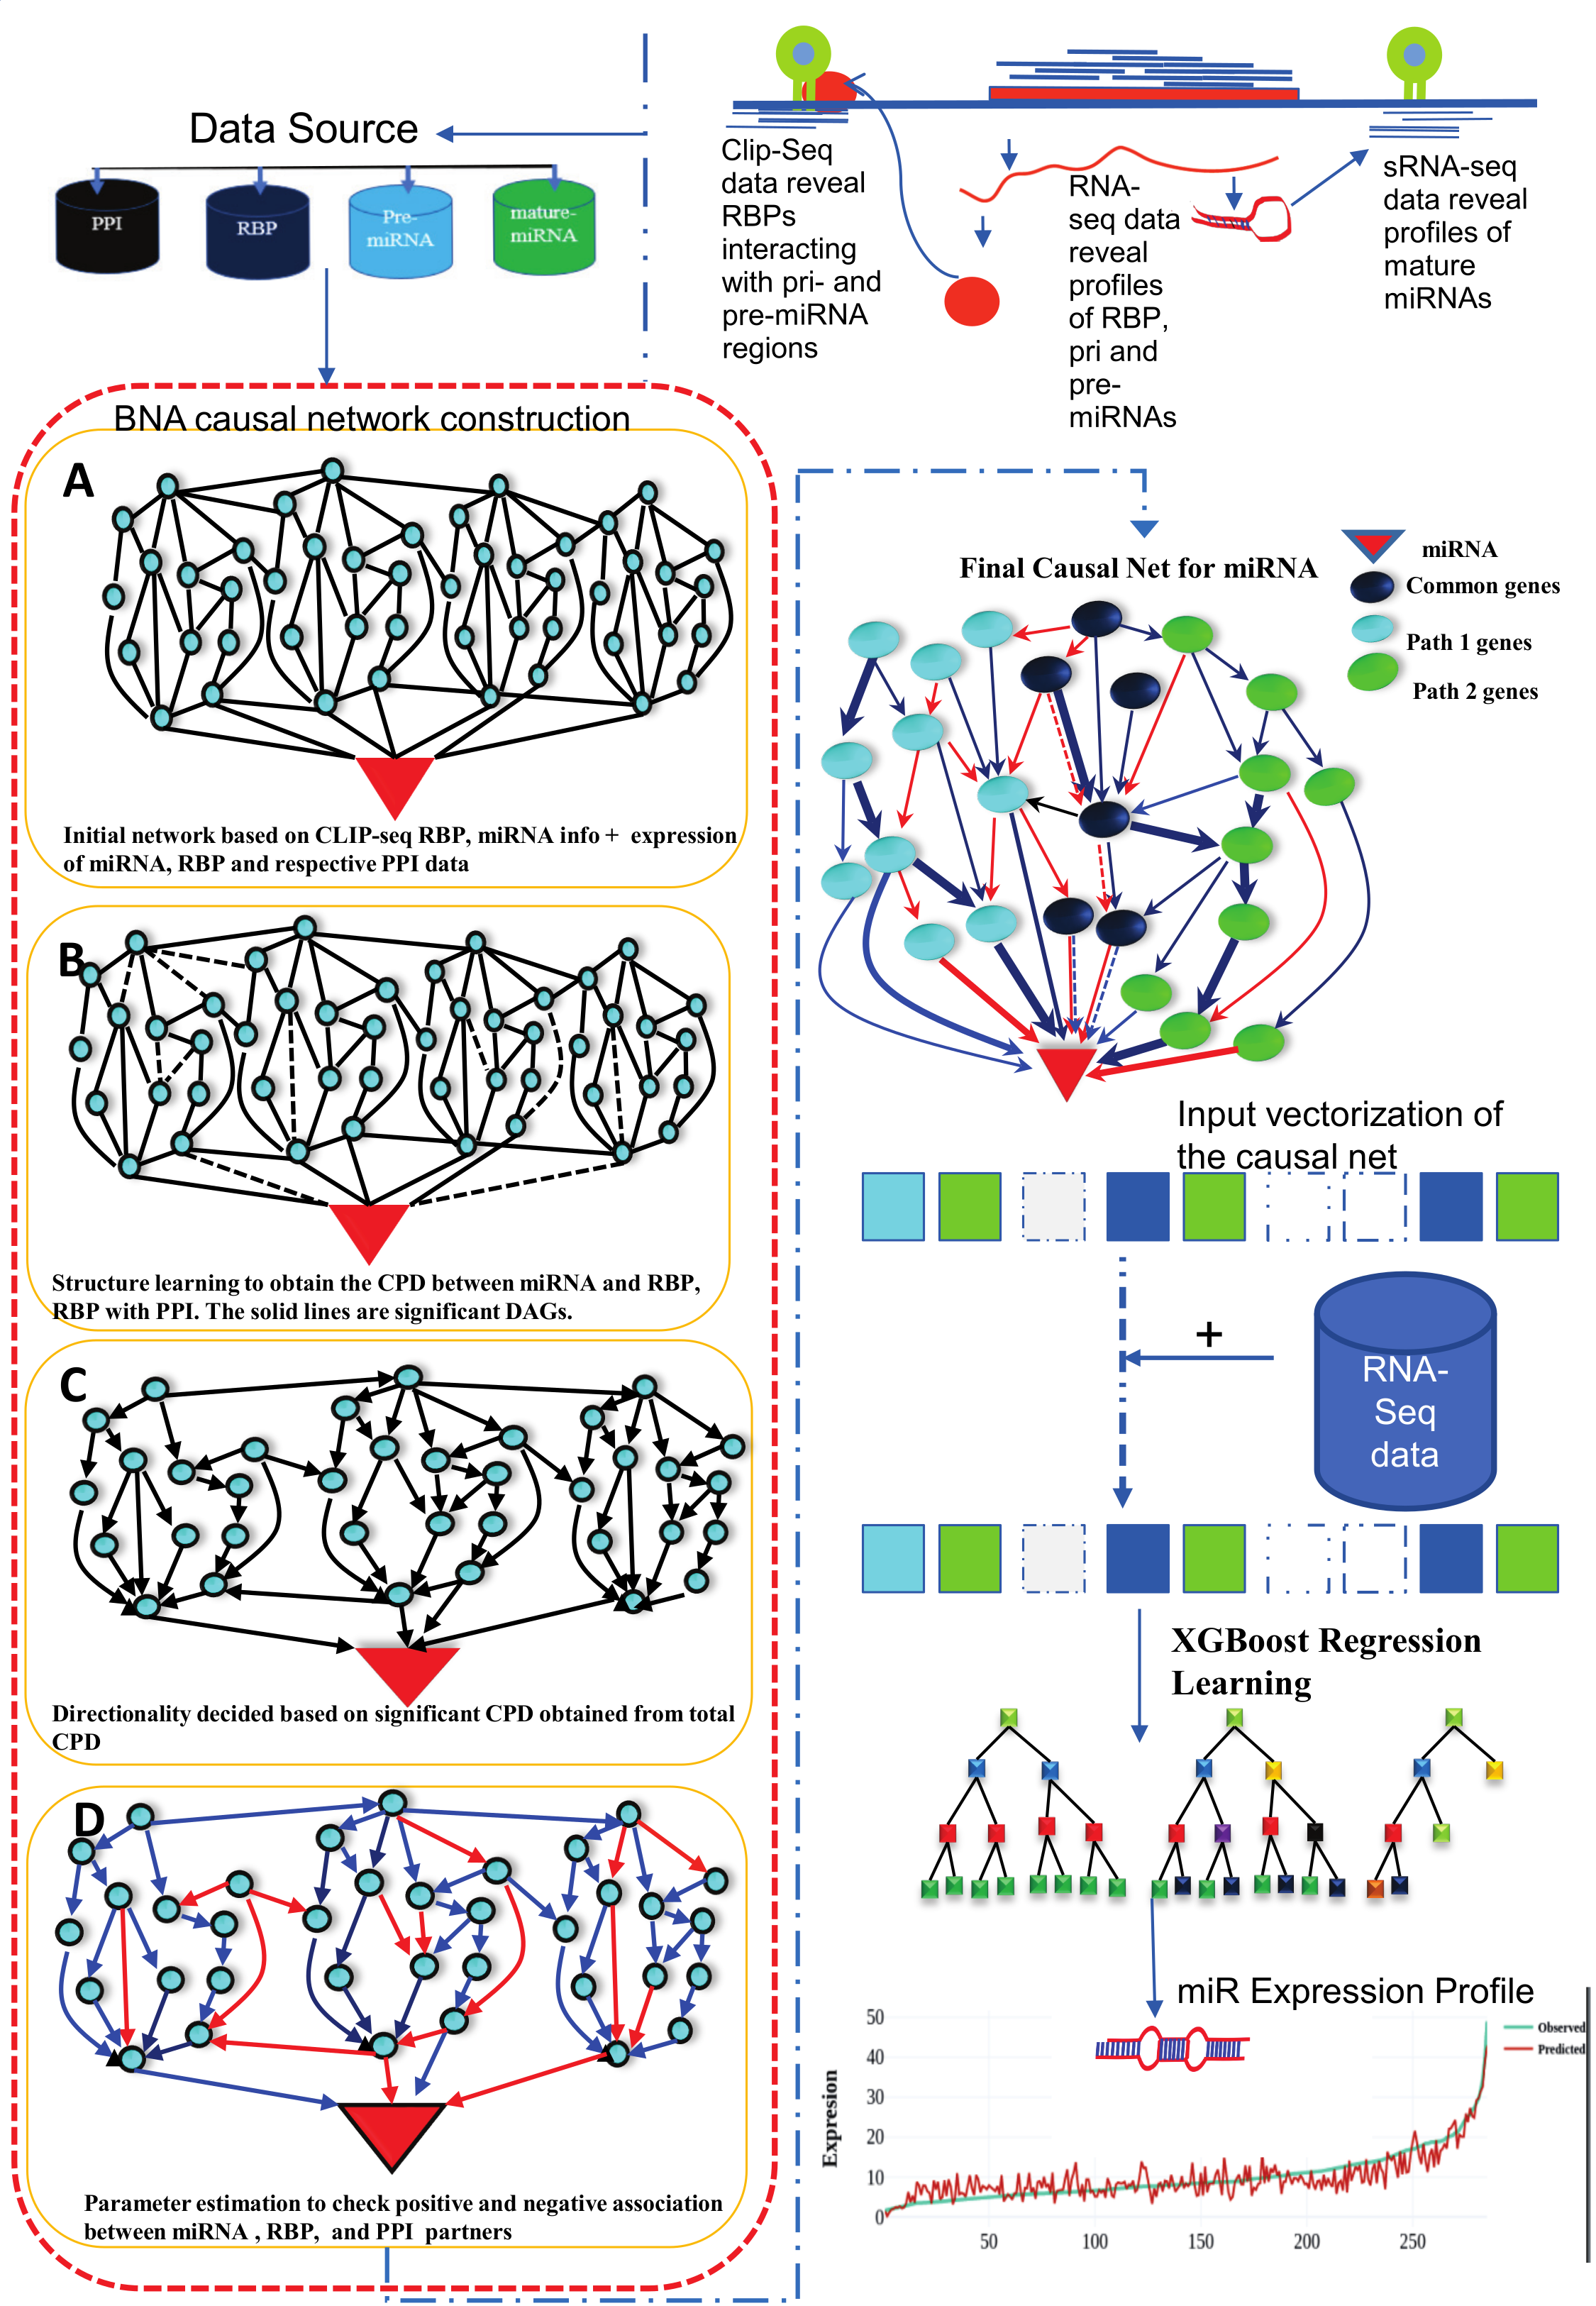
Figure-2: Work-flow of miRbiom prediction system implementation. High-throughput data from various platforms along with PPI data helped to build the initial network. BNA helped to reveal the functionally important connections and relationships, trimming the initial network while bringing directionality, causality, and preference. The fading edges represent insignificant associations, red edges are antagonist associations, and thickness of an edge is proportional to its recurrence/importance across various conditions. The final network for each miRNA works as an instruction set for the machine learning system (XGBoost) for learning and prediction system building. This uses RNA-seq data for the network components and miRNA expression data for various experimental conditions as the target to learn and build the prediction system. The finally built prediction system can accurately predict miRNA profiles for wide range of conditions.

miRNome profile detection using XGBoost regression

The goal was to create predictive models of miRNA expression based on the gene expression data. The RBP interaction network and its associated proteins obtained from miRNA biogenesis model based on the Bayesian network analysis were used for prediction of the miRNA expression level. The XGBoost regression model was used to build predictive model. XGBoost stands for extreme gradient boosting. For a given dataset with n samples and m features, $$D=\left\{\left(X_{i},y_{i}\right)\right\}\left(|D|=n,X_{i}\varepsilon R^{m},y_{i}\varepsilon R\right)$$ a tree ensemble model uses K additive function to predict the output $$ estimate\left(y_{i}\right)=Φ\left(X_{i}\right)= \sum_{k=1}^{K}f_{k}\left(X_{i}\right),f_{k}\varepsilon F...............(1) $$ where $$F=f_{k}=w_{q\left(x\right)}\left(R_{m}→T,W\varepsilon R^{T}\right)$$ is the space of regression trees. Here ‘q ‘represents the structure of each tree that maps an example to the corresponding leaf index. T is the number of leaves in a tree. Each $ f_{k} $ corresponds to an independent tree structure q and leaf weight w. Unlike decision trees, each regression tree contains a continuous score on each of leaf, we use $w_{i}$ to represent score on i-th leaf. To learn the set of functions used in the model, we minimize the following regularized objective $$ L\left(Φ\right)= \sum_{i}l\left(estimate\left(y_{i}\right),y_{i}\right)+\sum_{k}\Omega \left(f_{k}\right)...............(2) $$ where, $$ \Omega \left(f_{k}\right)= \gamma^{T}+\frac{1}{2}\lambda ||w||^{2}$$ Here ‘ι’ is a differentiable convex loss function that measure the difference between the prediction $estimate(y_{i}$ and target $y_{i})$ . The second term, Ω, penalizes the complexity of the regression tree function. The additional regulizer term helps to smoothen the final learned weight to avoid over-fitting. Intuitively, the regularized objective will tend to select a model employing simple and predictive functions.

The RNA-seq and sRNA-seq expression data were collected from TCGA database for seven different tissues (both normal and cancer). These data are independent of the 47 experimental conditions used in the construction of miRNA biogenesis models. Additional eight different tissue condition data were used separately from TCGA for further validation of the tool. The predictive models were validated considering the following statistical measures: $$ RMSE= { \sqrt{\sum_{i=1}^{n}{\left(Predicted\left(y_{i}\right) - observed\left(y_{i}\right)\right)^{2} \over n}}}..............(3) $$ To check the predictive accuracy of each model Relative mean absolute percentage error (RMAPE) was used. The RMAPE is widely used to validate forecast accuracy, which provides an indication of the average size of prediction error expressed as a percentage of the relevant observed value irrespective of whether that prediction error is positive or negative. $$ RMAPE= \frac{1}{n}{ \sum_{i=1}^{n}|\left(observed\left(y_{i}\right) - Predicted\left(y_{i}\right)\right)| \over observed\left(y_{i}\right)}\times100 .....(4)$$ $$ Model\space Accuracy = 100 - RMAPE ..............................(5) $$ Once the model has been trained. We can't assume, it can work well on data that it hasn't seen before. In other words, it can not be certain that the model will have the desired accuracy and variance in the environment of production. It needs some form of confirmation that the predictions our model is sending out are accurate. For that, our model needs to be validated. The process of determining whether the numerical results which quantify hypothesized relationships between variables are appropriate as data descriptions is known as validation. To evaluate the performance of any machine learning model we need to test it on some unseen data. Based on the models performance on unseen data we can say weather our model is Under-fitting/Over-fitting/Well generalized. Cross-validation (CV) is one of the authentication technique used to test the effectiveness of the build model, and is also a re-sampling procedure used to evaluate that model. We need to hold a sample / portion of the data that is not used to train the model to perform a CV. A 10-fold cross-validation method was applied to verify the accuracy of the models, and accuracy was tested based on the RMSE value.

Figure-3: This diagram used zoomable graphic and tabular view to illustrate predicted mature-miRNA. Bubble size shows log2 expression value where larger size has higher expression value. Each bubble is linked with enrichment analysis. A searchable and downloadable table with links for further study for a specific mature-miRNA along with its enricment analysis button is also provided here.

Model benchmarking and comparison with actual data

To test how close miRbiom predicts to the actual expression profile, this module has been provided. The user needs to provide actual miRNAs expression data of same experimental condition. After submission of the data we get results from the webserver which provides accuracy(%), Root Mean Square Error (RMSE), Mean Absolute Percentage Error (MAPE) and line plot of expression value between actual vs predicted miRNAs using plotly.js.

Figure-4: This snapshot shows the process and results of benchmarking the model using actual miRNAs expression data fron the same experimental condition.

Enrichment Analysis

Enrichment analysis is done using Enrichr in the background. Snapshot of tabular view of enrichment analysis result given below when clicking on bubble (ex. hsa-let-7a-2-3p) in bubble plot or clicking on GE Analysis column of corresponding to miRNA (ex. hsa-let-7a-2-3p) in expression table.

Figure-5: This snapshot shows the results of the enrichment analysis. Click on the link in the table of any pathway to get map their associated genes with the KEGG pathway.

Path Mapper

Path Mapper is a tool for integration and visualisation of data based on the KEGG pathway. Path mapper was implemented using PATHVIEW API. The path mapper mapps the gene where the log2(expression value) > = 0 is colored with yellow color and log2(expression value) less than 0 is colored with red in the pathway graph.

Figure-6: This image illustrated mapped pathway of associated gens of selected KEGG pathway

References
  1. miRTarBase 2020: updates to the experimentally validated microRNA–target interaction database.
    Huang H-Y, Lin Y-C-D, Li J, Huang K-Y, Shrestha S, Hong H-C, et al.
    Nucleic Acids Res., 2020, 48, D148–54.  Get access article here
  2. Enrichr: a comprehensive gene set enrichment analysis web server 2016 update.
    Kuleshov MV, Jones MR, Rouillard AD, Fernandez NF, Duan Q, Wang Z, et al.
    Nucleic Acids Res., 2016, 44, W90–7.  Get access article here
  3. Protocol Update for large-scale genome and gene function analysis with the PANTHER classification system (v.14.0).
    Mi H, Muruganujan A, Huang X, Ebert D, Mills C, Guo X, et al.
    Nature Protocols, 2019, 14, 703–21.  Get access article here
  4. KEGG Mapper for inferring cellular functions from protein sequences.
    Kanehisa, M. and Sato, Y.
    Protein Sci., 2020, 29, 28-35.  Get access article here
  5. Xgboost: A scalable tree boosting system.
    Chen, T. and Guestrin, C.
    In Proceedings of the 22Nd ACM SIGKDD International Conference on Knowledge Discovery and Data Mining, 2016, 785–794.  Get access article here
  6. Pathview Web: user friendly pathway visualization and data integration.
    Luo, W., Pant, G., Bhavnasi, Y.K., Blanchard, S.G. Jr, Brouwer, C.
    Nucleic Acids Res. , 2017,45(W1):W501-W508.  Get access article here