The miRbiom server (https:/scbb.ihbt.res.in/miRbiom-webserver) is a miRNA profiler software. The purpose of the miRbiom server is to predicted an accurate profie the miRNAs without any need for miRNA-sequencing or array profiling experiments. For any given condition, the users needs to provide the transcriptome profiling data and just run the software after loading it. The data passed through causal networks for miRNAs which explain the miRNA biogenesis. In term, the network is mapped for the component genes expression data on which XGBoost regression machine learning system takes decision. Finally the XGBoost machine learning system gives the relative expression scores of all the miRNAs for the given condition. It generates interactive plot of expression profiles of different miRNAs. Selections can be made to study the miRNA targets for their functional enrichment and associated pathways. miRNA target information comes from various databases like miRTarbase etc. Provisions were also made for mapping the miRNA targets collectively and displaying them in maps of KEGG pathways. The implementation details of this part is given below in Figure1 and Figure 2:
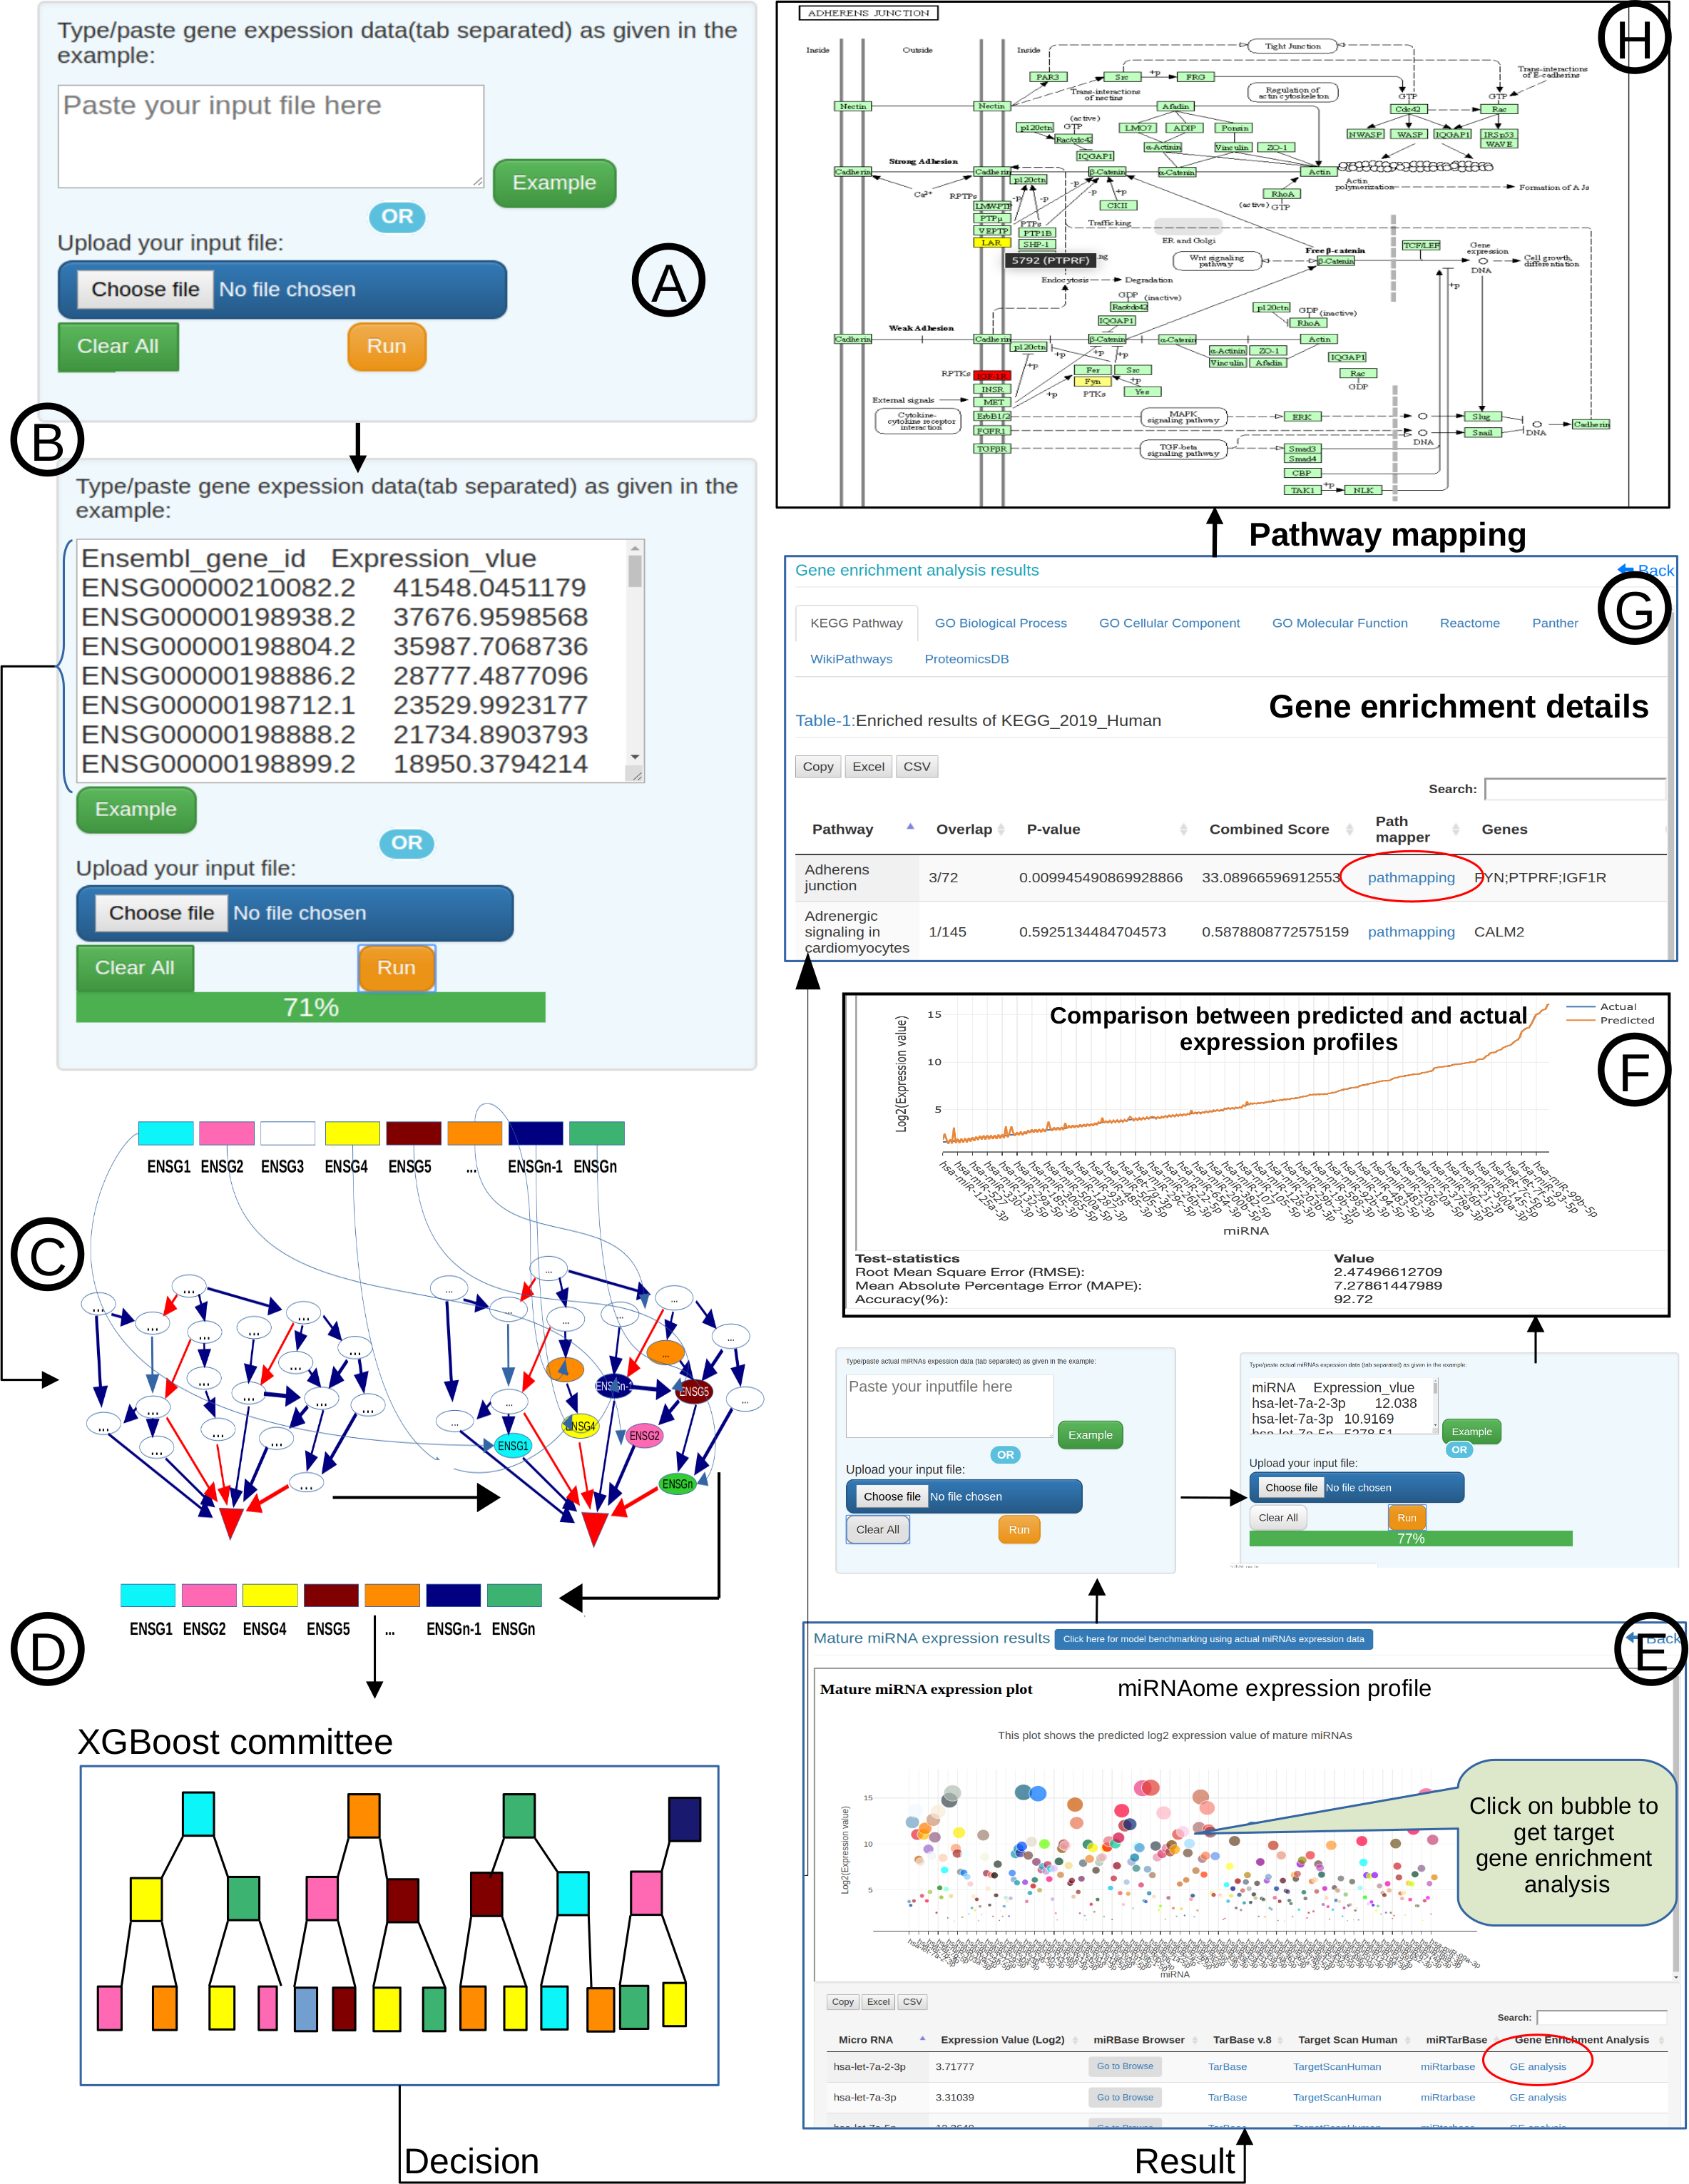
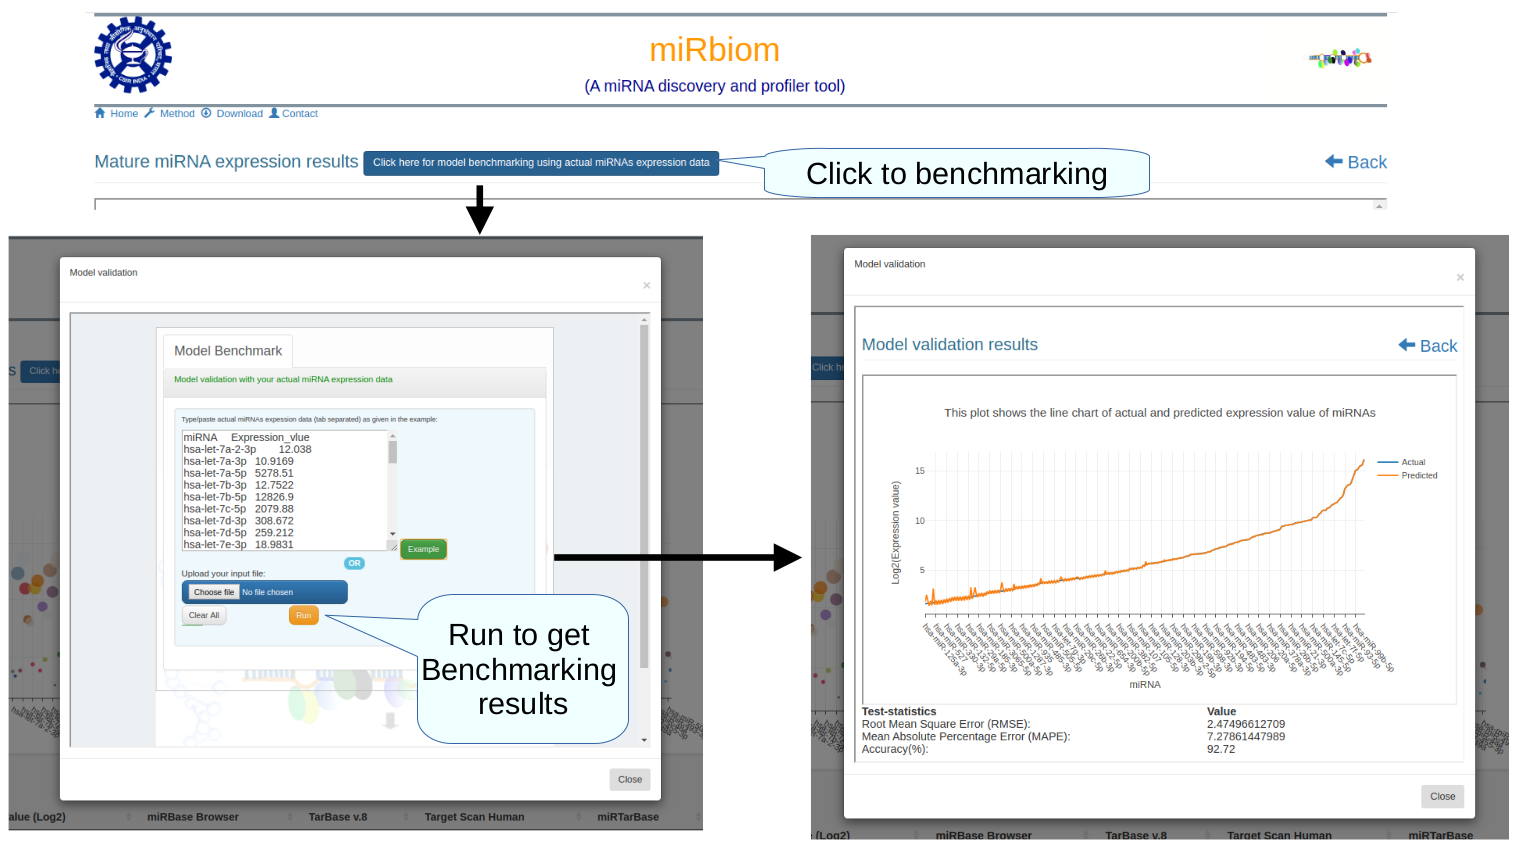
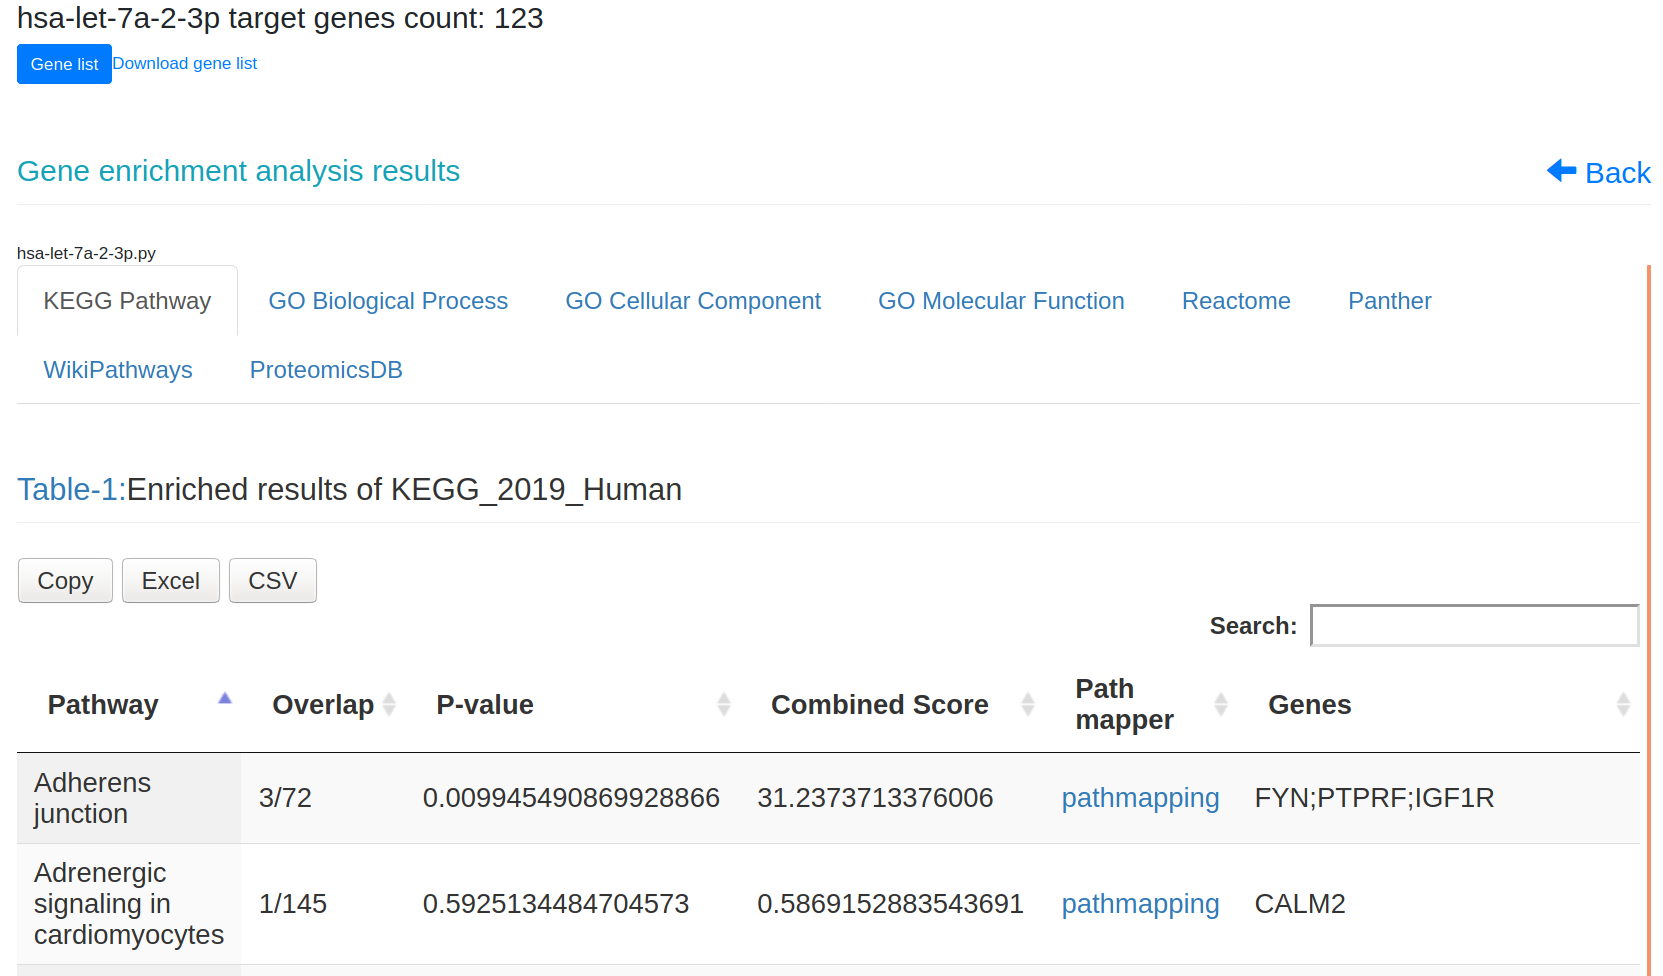
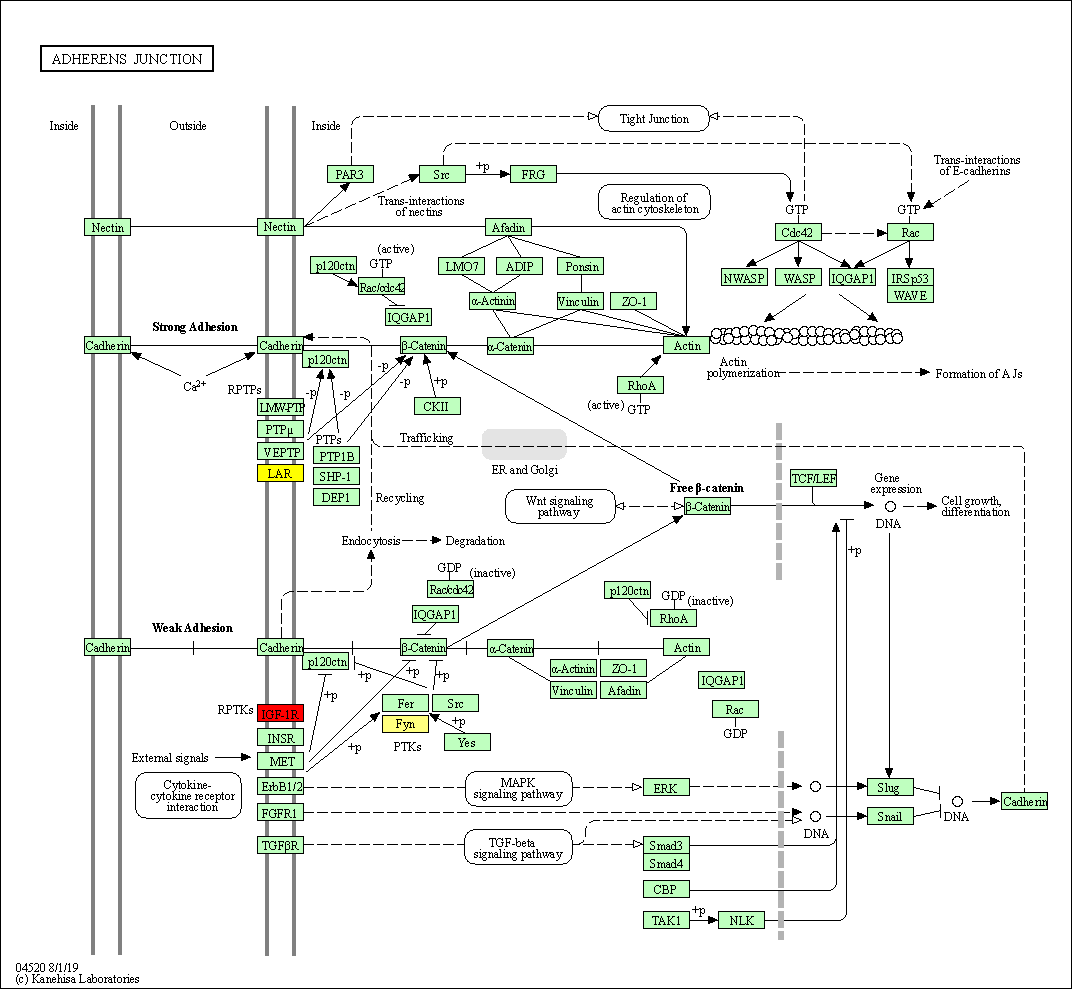
Figure-1: miRbiom webserver implementation. A) Input data box where the user can either paste or load the input file, B) Input is transcriptome expression data with Ensembl IDs which is in turn normalized by the server, C) The causal network components are consulted and loaded with their respective expression data, D) XGBoost regression uses the network expression data to generate a jury of classifiers which commonly reach to decision with the expression profiles for various miRNAs in one go, E) Expression profile result is generated in the form interactive plot and table, F) A module is provided to compare the predicted profile with the actual profile for test purpose, if the user wishes to, G) Functional enrichment analysis tabs for the targets of the miRNAs, H) Pathways mapping module for the miRNA targets.

Figure-2: Work-flow of miRbiom prediction system implementation. High-throughput data from various platforms along with PPI data helped to build the initial network. BNA helped to reveal the functionally important connections and relationships, trimming the initial network while bringing directionality, causality, and preference. The fading edges represent insignificant associations, red edges are antagonist associations, and thickness of an edge is proportional to its recurrence/importance across various conditions. The final network for each miRNA works as an instruction set for the machine learning system (XGBoost) for learning and prediction system building. This uses RNA-seq data for the network components and miRNA expression data for various experimental conditions as the target to learn and build the prediction system. The finally built prediction system can accurately predict miRNA profiles for wide range of conditions.

