
Main Figures
Key figures from the CTF-BIND research manuscript demonstrating core findings and methodologies.
Figure 1: Spatio-Temporal Dynamics and Pathways
Figure 2: Bayesian Network Reconstruction
Figure 3: Comprehensive Workflow of the CTF-BIND Framework.
Figure 4: CTF-BIND Framework Architecture
Figure 5: Illustration of feedback loops, their temporal unfolding into Directed Acyclic Graphs (DAGs) for three biological pathways.

Figure 6: Causal Regulatory Pathways
Figure 7: TF Cooperativity
Figure 8: Performance Evaluation of TF Models
Figure 9: Grad-CAM Visualization
Figure 10: Validation of CTF-BIND in Arabidopsis Cold Stress
Figure 11: Case Study on RD29A Gene

Figure 12: CTF-BIND-DB Implementation
Supplementary Figures
Additional figures providing detailed supporting evidence and extended analyses for the main findings.
Figure S1: Distribution patterns for TFs binding across genes.
Figure S2: Dynamic Time-varying network of different time points (T1 ~ T6) for Cold stress experiment data in Arabidopsis.
Figure S3: Dynamic Time-varying network of different time points (T1 ~ T6) for Heat stress experiment data in Arabidopsis.
Figure S4: Dynamic Time-varying network of different time points (T1 ~ T6) for Drought stress experiment data in Arabidopsis.
Figure S5:Dynamic Time-varying network of different time points (T1 ~ T6) for Salinity stress experiment data in Arabidopsis.
Figure S6: Ablation analysis for three main properties for discriminating between the negative and positive instances.
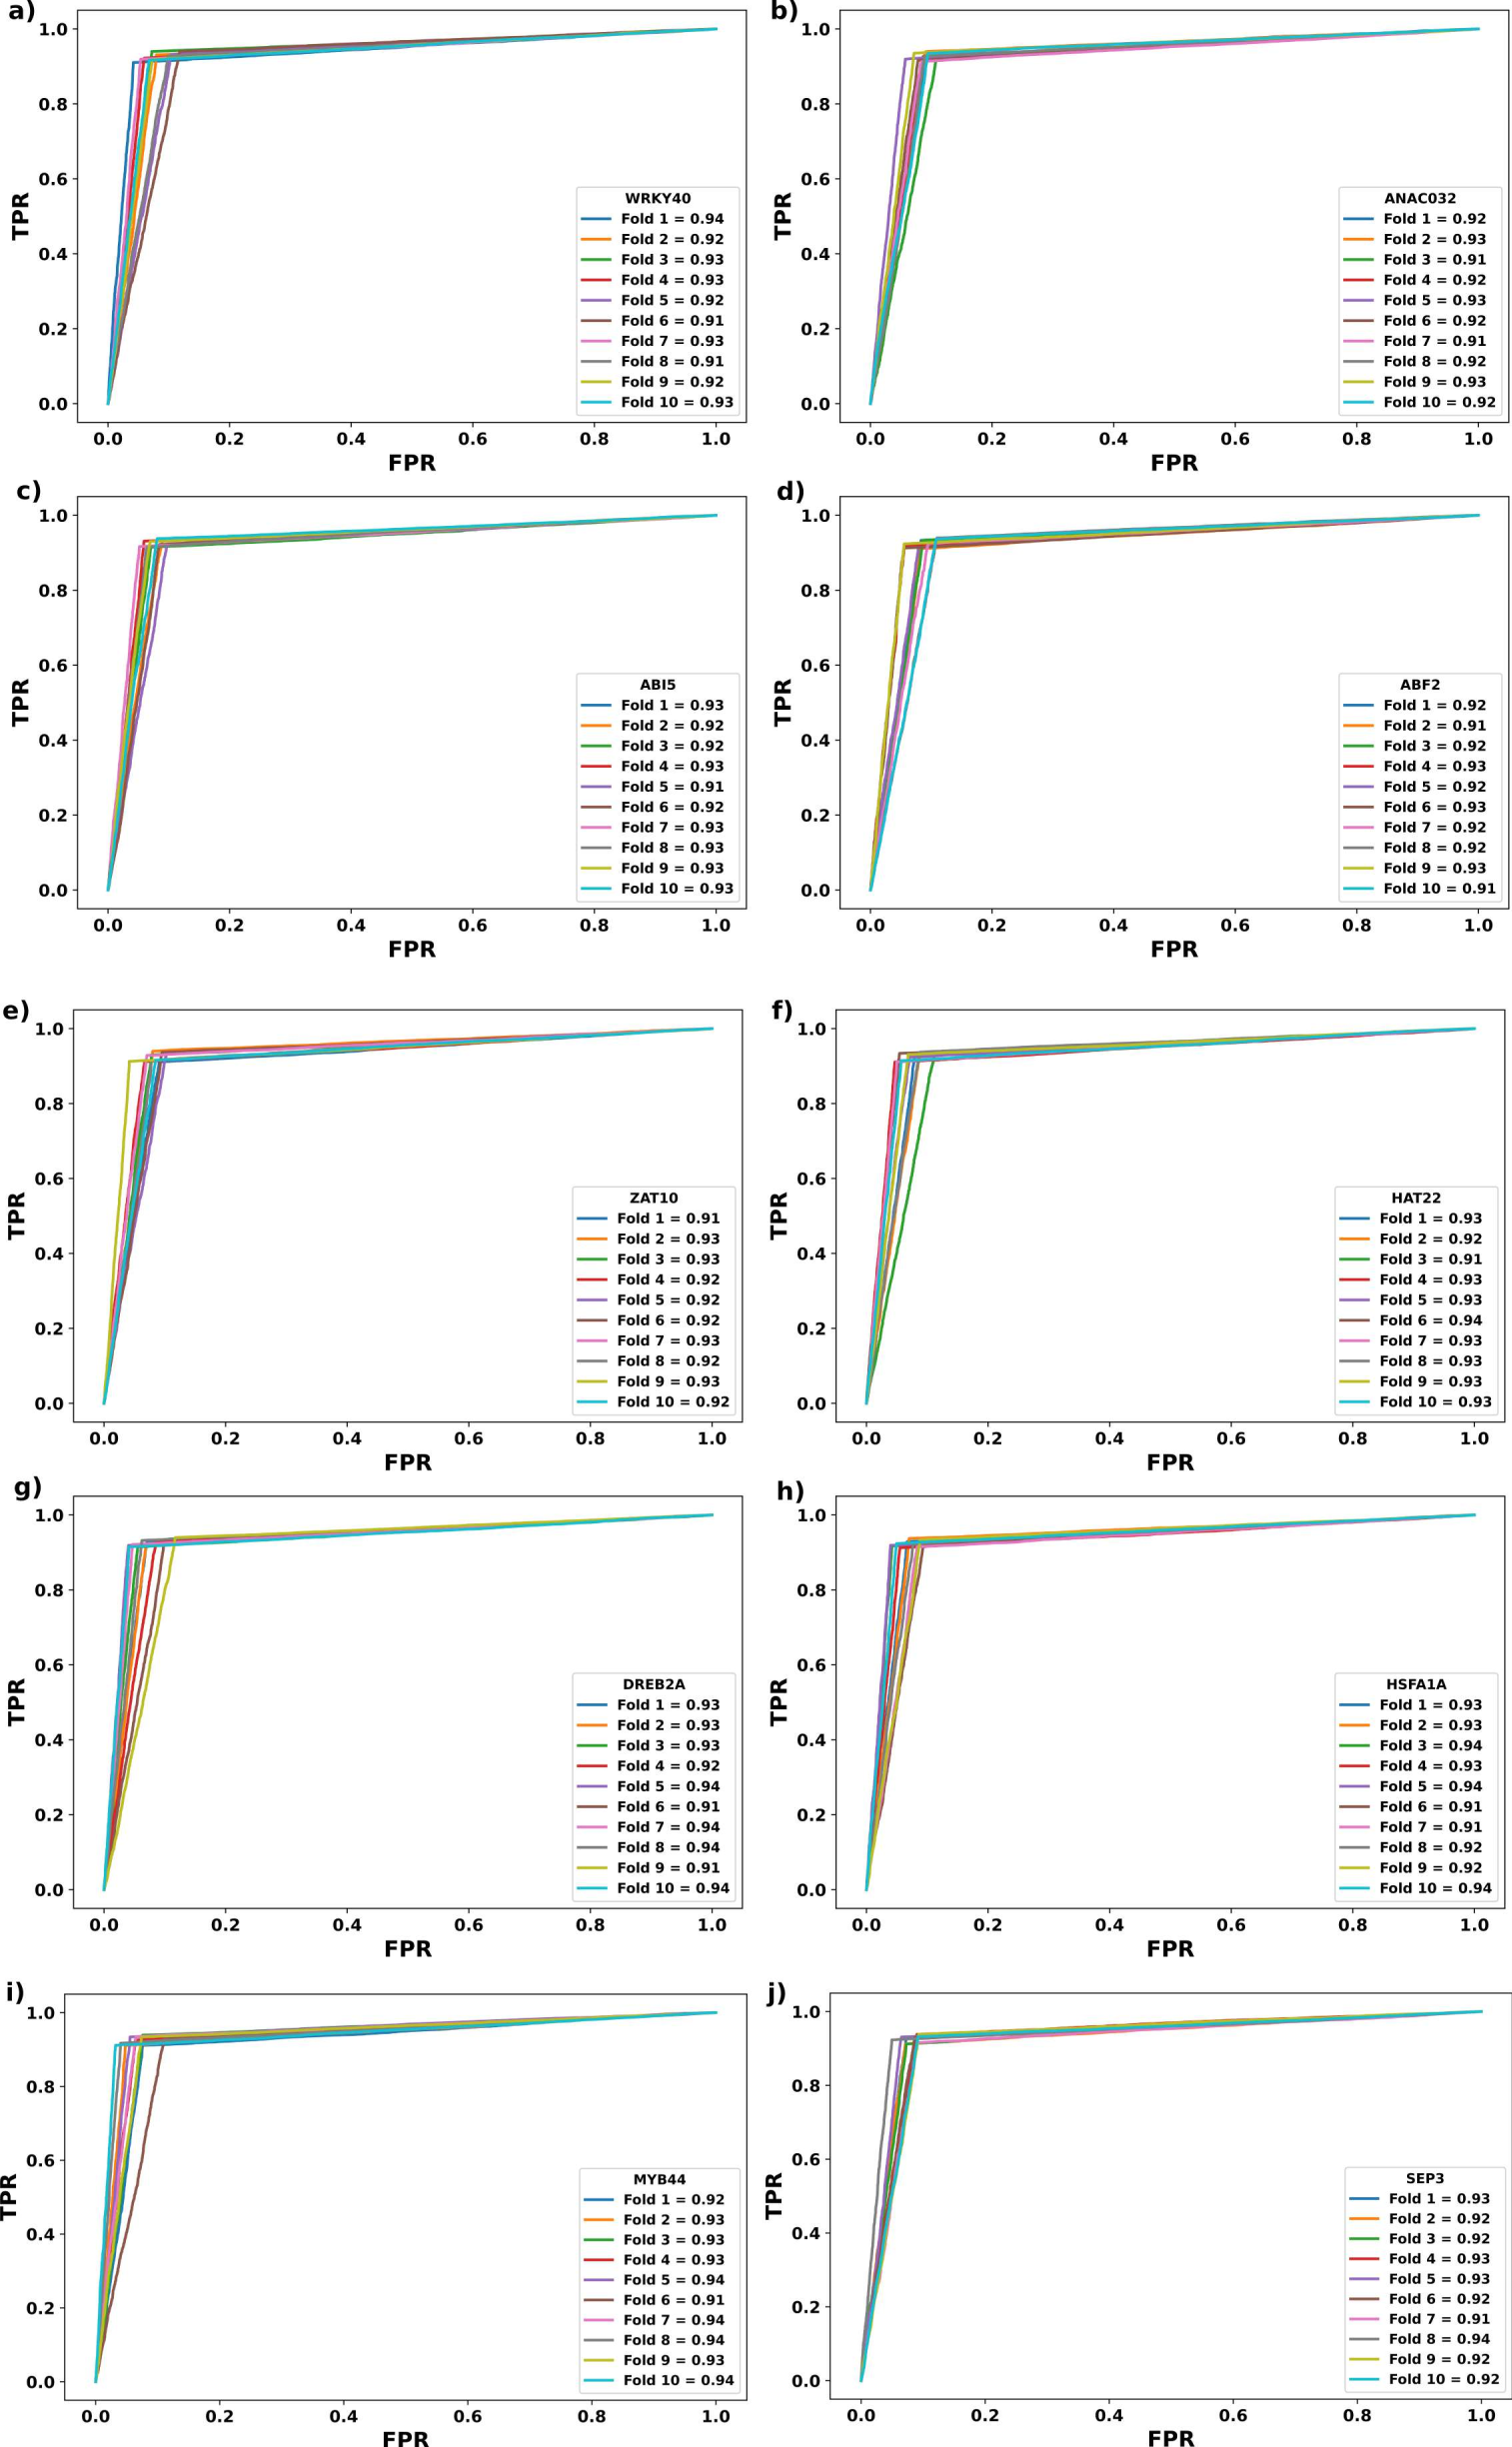
Figure S7: valuation of CTF-BIND performance using 10-fold random trials on Dataset "C".
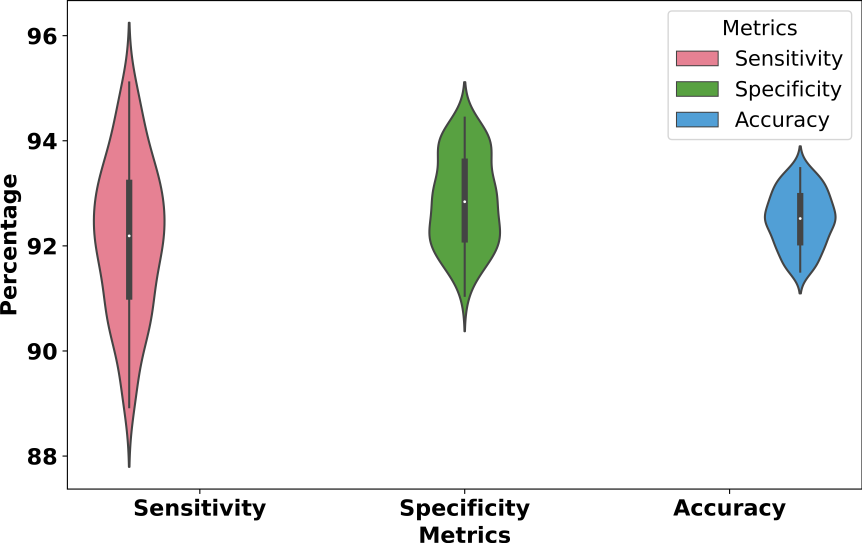
Figure S8: Performance evaluation distribution across the remaining 100 transcription factors (TFs)
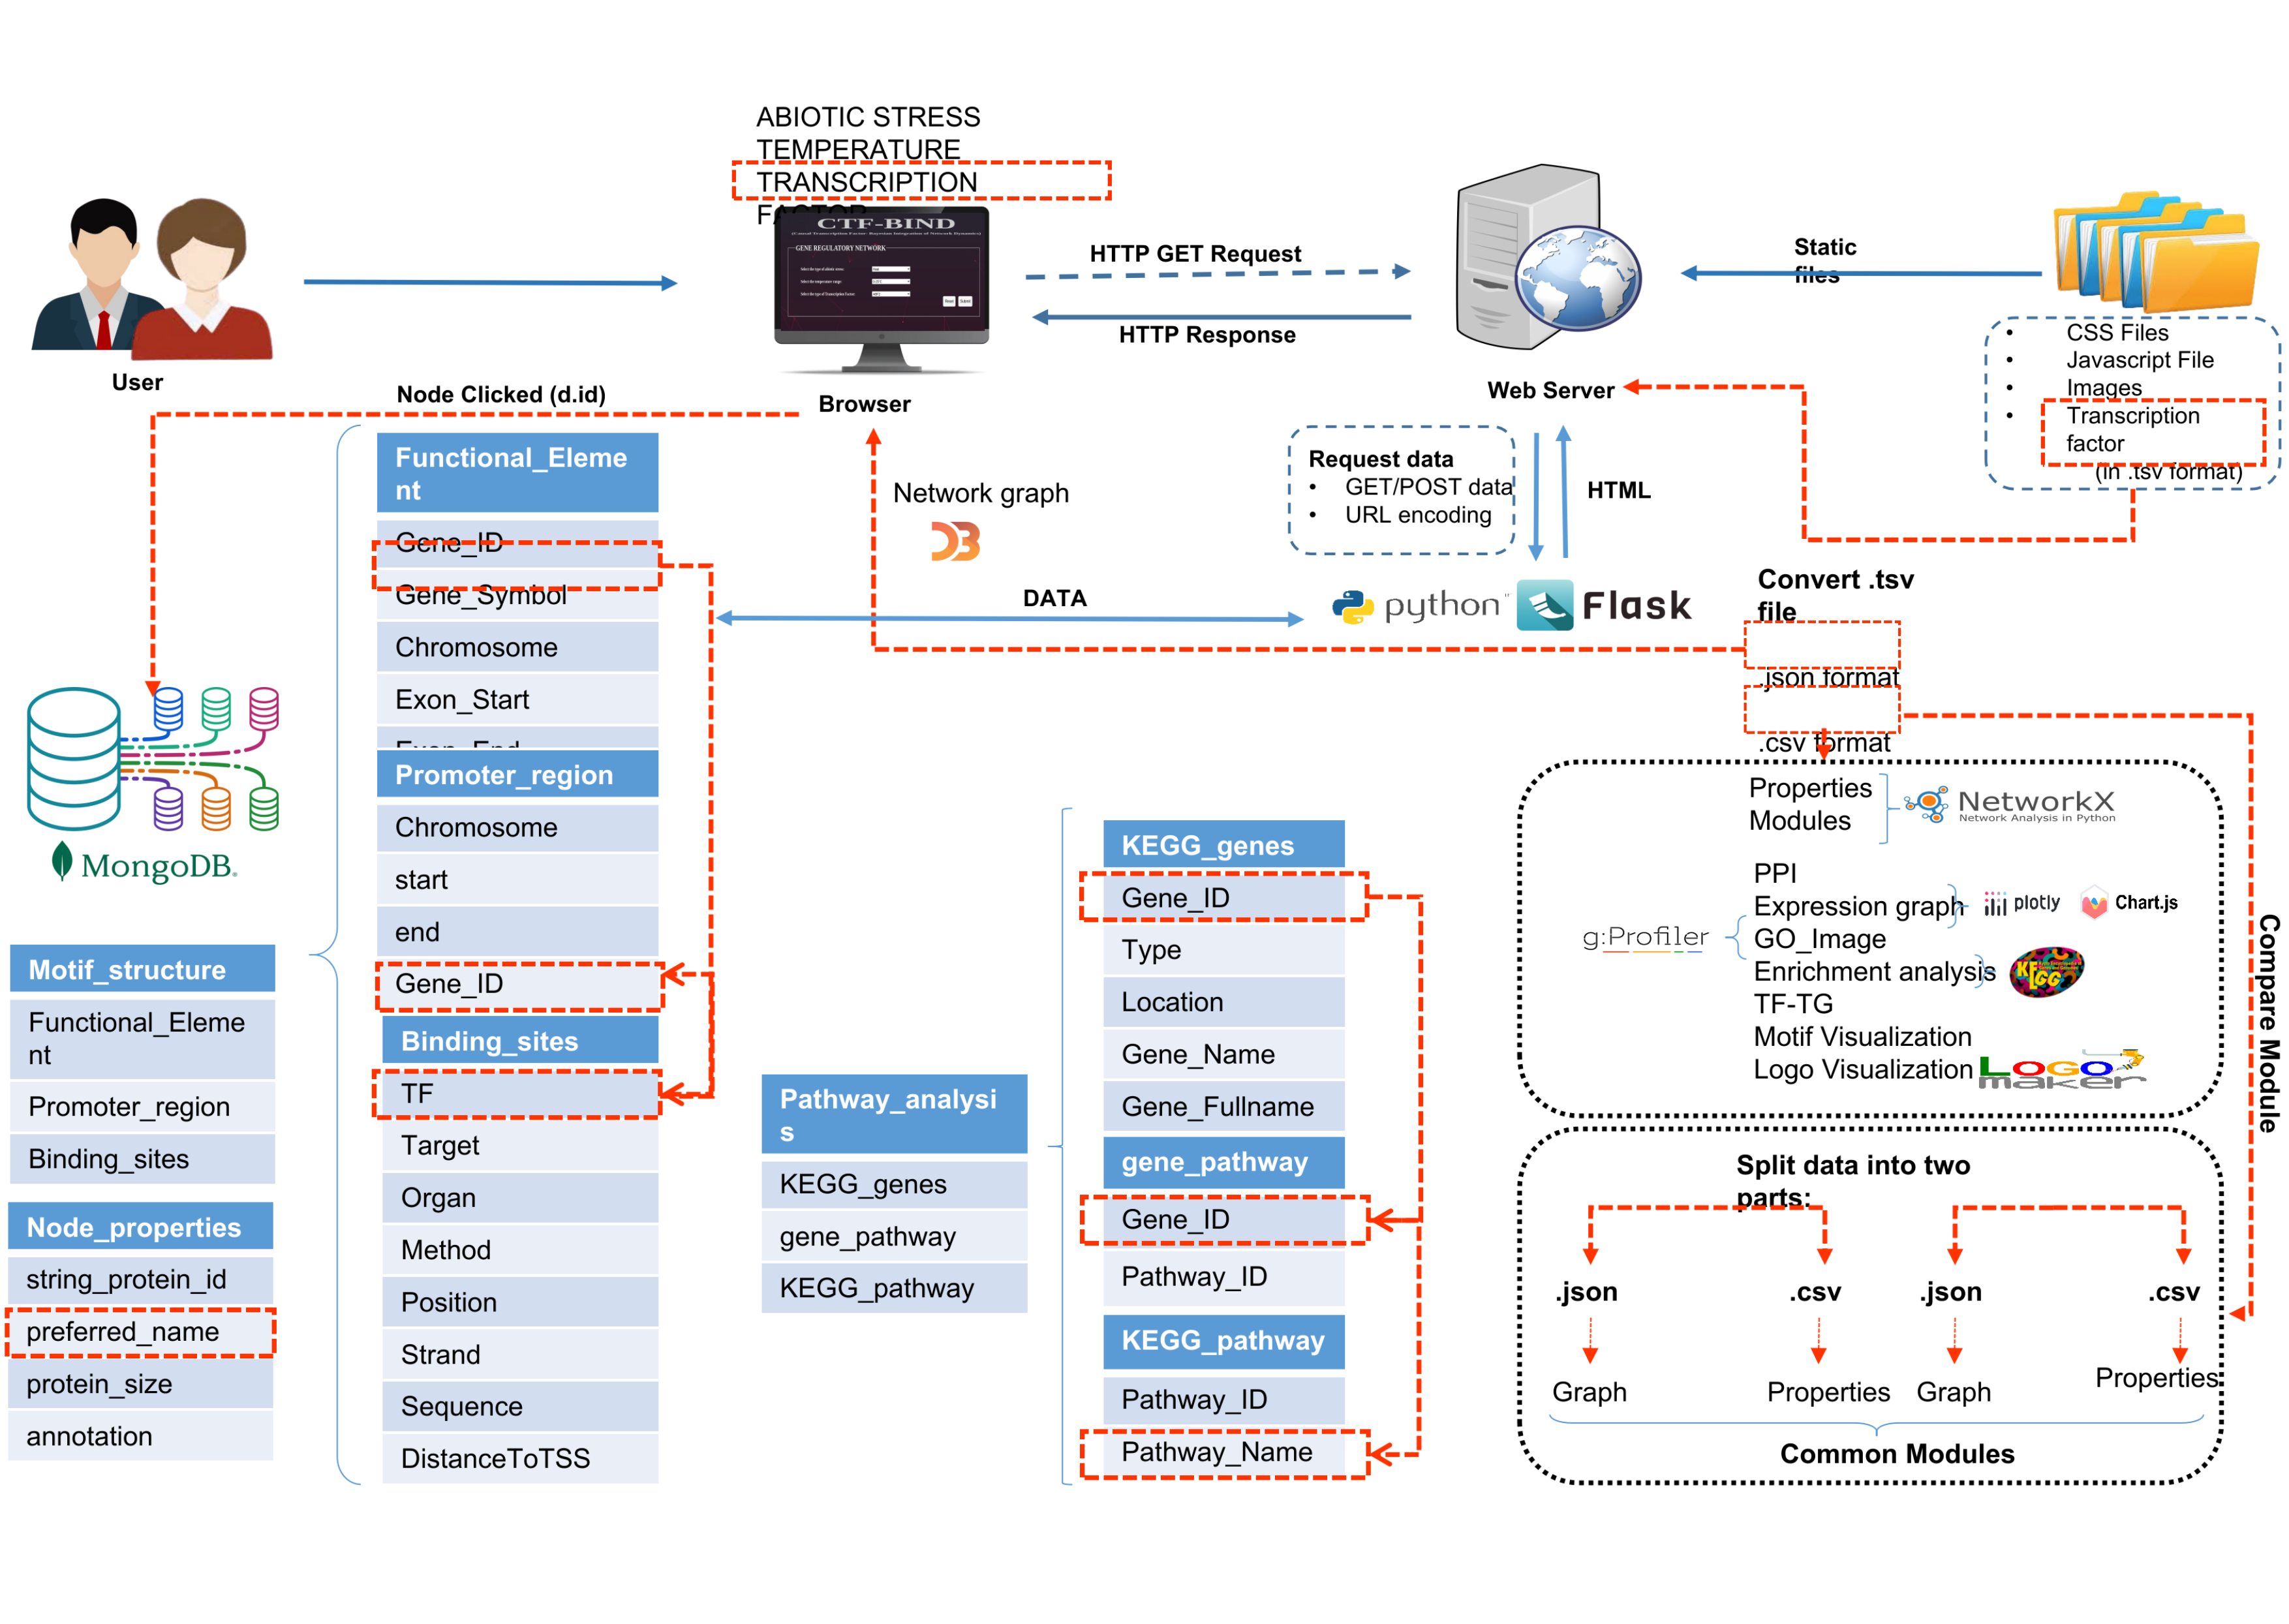
Figure S9: Diagram outlines CTF-BIND's Entity-Relationship (ER) architecture for analyzing plant transcription factor networks.
Figure S10: Complete User Experience Workflow
Supplementary Tables
Supplementary Files
Downloadable data files associated with this research.