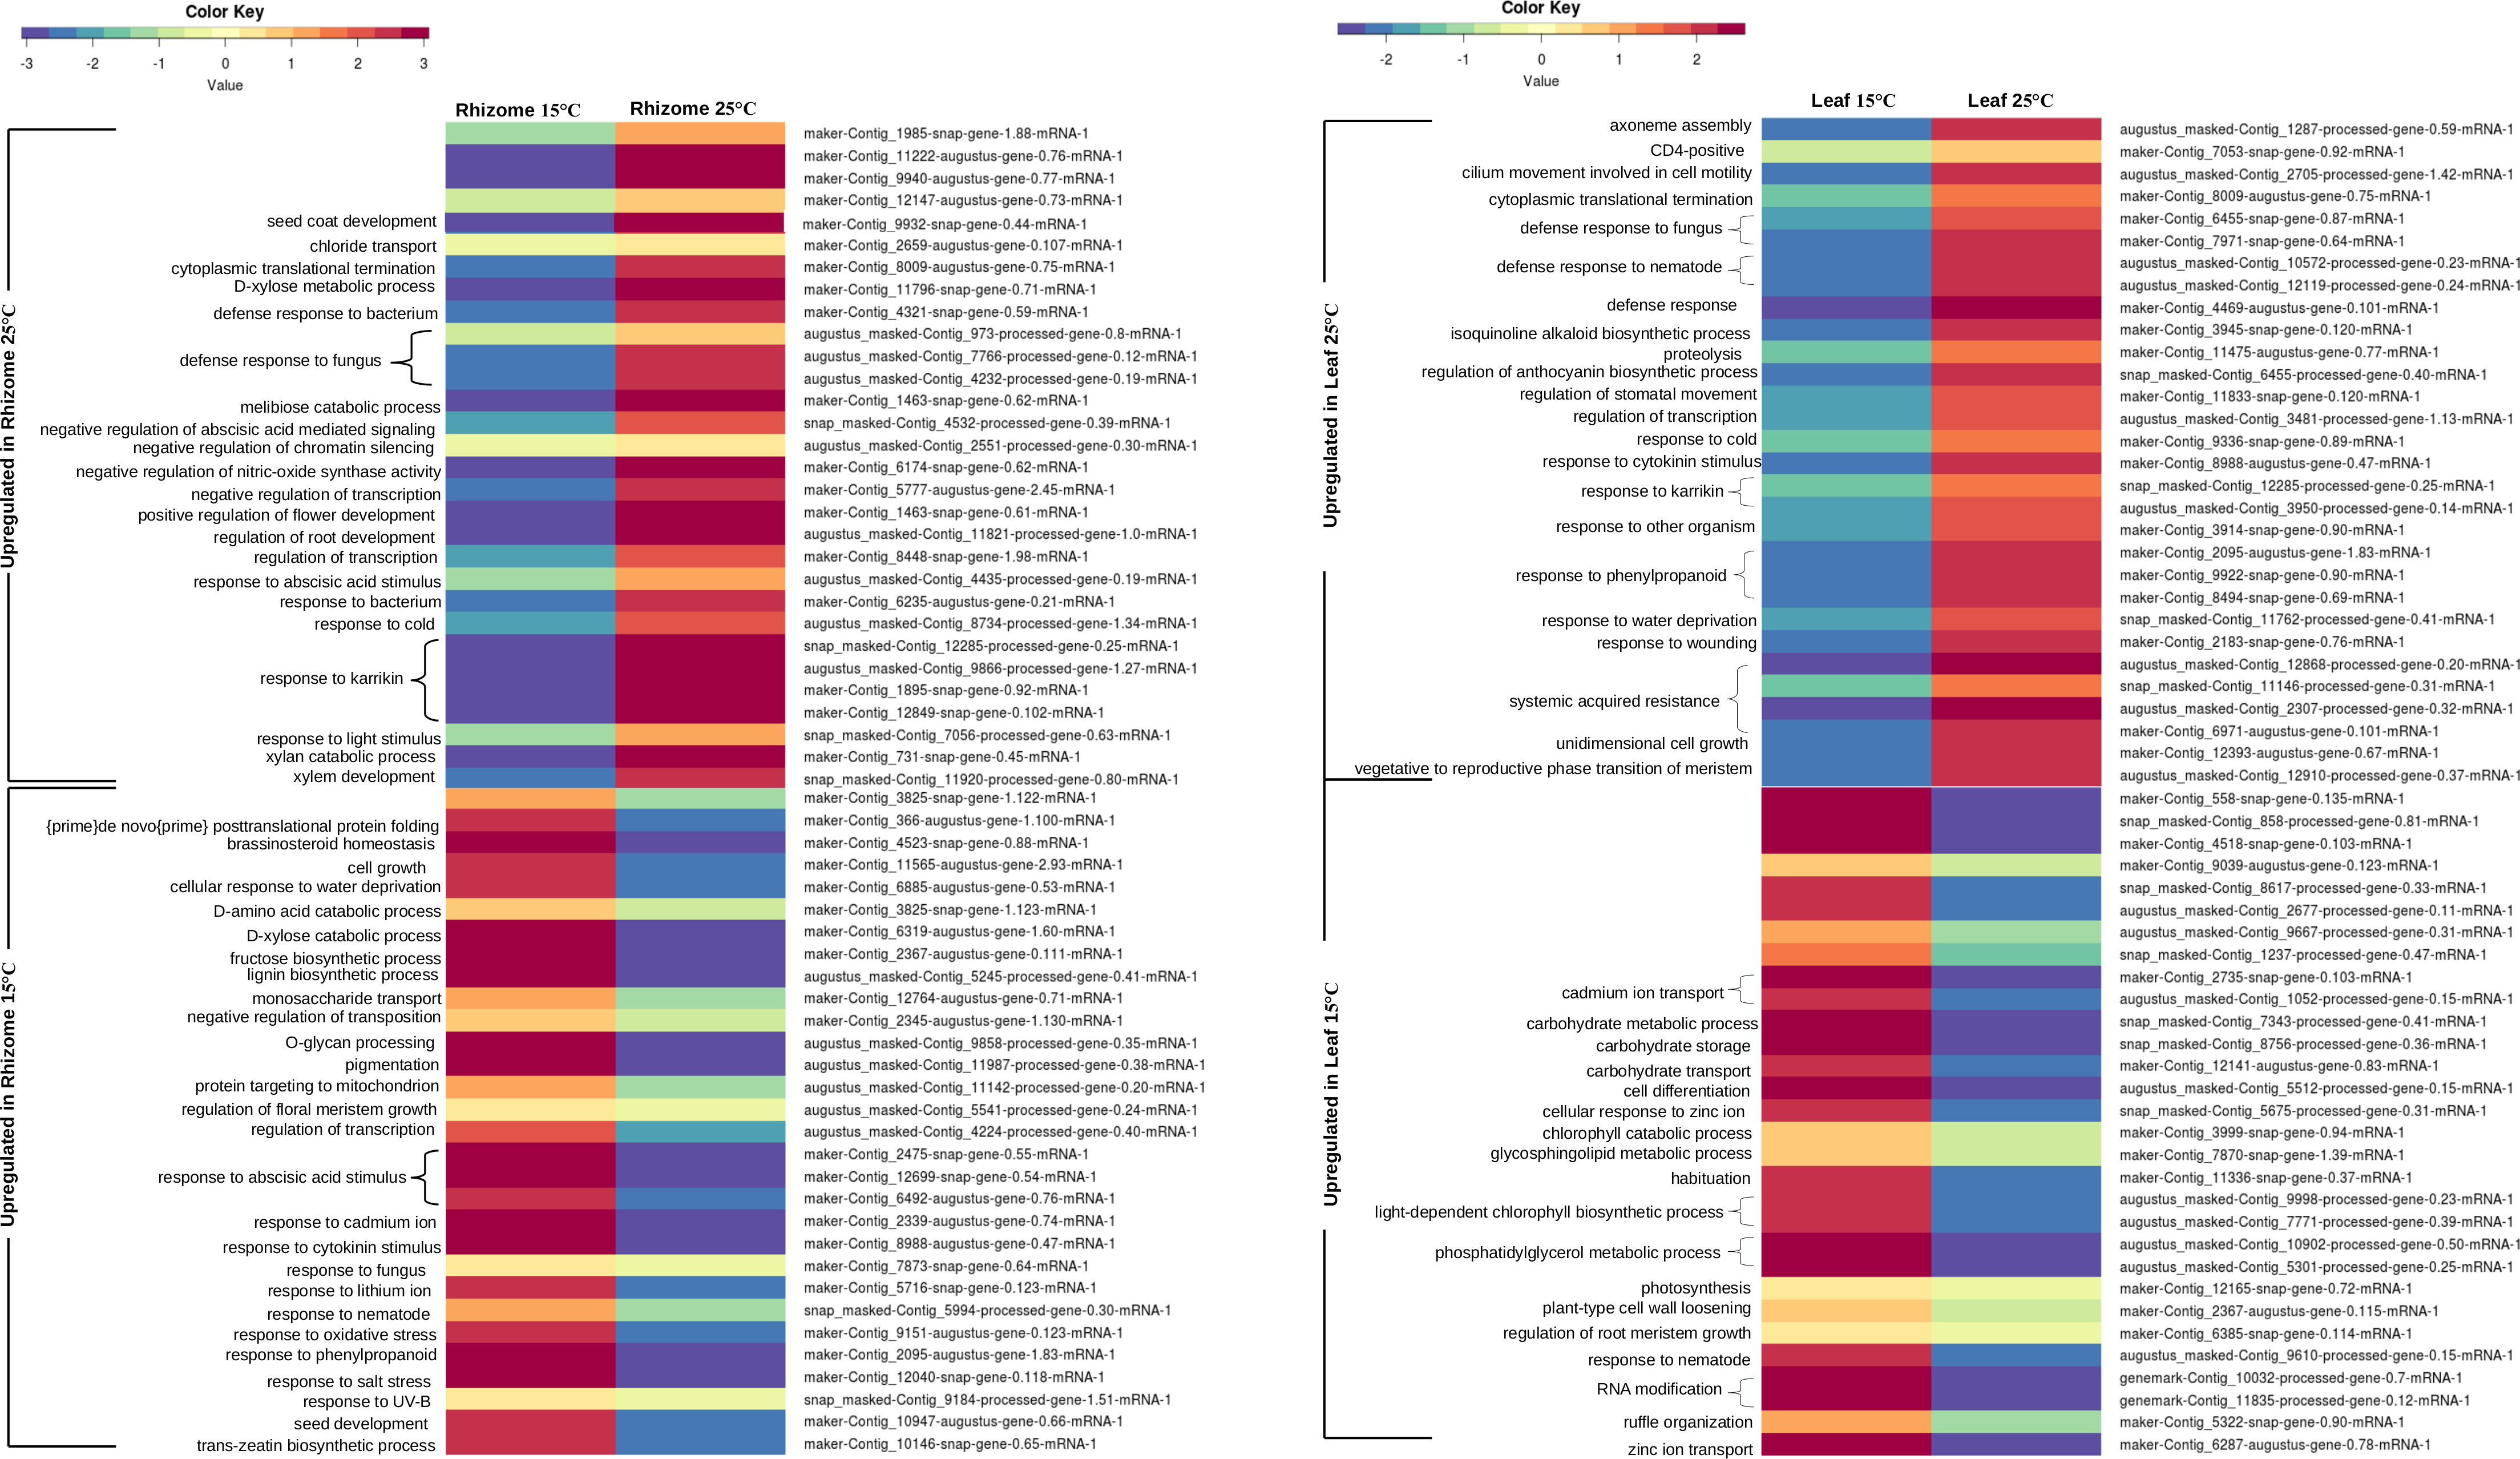
Figure-9: Heatmap
Description
Heatmaps for top 30 differentially expressed transcripts according to fold change in four different comparative condition
Heatmaps for top 30 differentially expressed transcripts according to fold change in four different comparative condition

